Executive Summary - The Earnings Mirage: Why Corporate Profits are Overstated and What It Means for Investors
By Patrick O’Shaughnessy
July 2019
This is a summary of findings from a recent long-form research piece by Jesse Livermore+, "The Earnings Mirage".
Watch as Patrick O’Shaughnessy addresses the issues with Book Value on Bloomberg
Executive Summary
The conceptual problems with book value as an accounting tool are well-known. But one problem that often gets missed is the problem of inflation. Book values are not adjusted for inflation over time, and therefore they tend to understate the true value of corporate net assets. We recently developed a new technique for calculating book value, called “integrated equity” that corrects this distortion. Our original research piece, "The Earnings Mirage" carefully explains this technique and uses it to generate data for sectors, countries, periods of history, and even factors.
Here are a few highlights of our findings from the piece:
- Inflation doesn't just distort book values--it also distorts earnings. It causes depreciation to be understated in current price terms, which causes earnings to be overstated. We believe this to be one of the main reasons why inflation has historically been associated with low valuations, i.e., low P/E multiples. During periods of high inflation, the market detects the fact that earnings are overstated, and correctly assigns lower multiples to them.
- When measuring valuation and profitability in individual stocks, the risk of depreciation-related earnings overstatement highlights the importance of using free cash flow as a metric in the investment process. Free cash flow is the only fundamental metric that empirically tracks depreciation-related expenses. Unsurprisingly, when tested out as a factor, it outperforms other fundamental metrics.
- Historically, high buyback firms have had high returns on equity, further bolstering our confidence in the factor.
- The integrated equity methodology can be used to build a valuation measure for the overall stock market. When compared to other measures such as the Shiller CAPE, it shows a noticeably stronger correlation with long-term future equity returns.
We say more about these findings below:
Book Value, Earnings, and Free Cash Flow
Book-value-based measures such as price-to-book and return on equity compare terms that have been expressed in different price units, leading to lopsided, distorted results.
When a company reports its book value, the assets are reported at the original cost paid, net of depreciation (“historical cost”), rather than at today’s real replacement value. Because there's no adjustment for inflation, book values tend to become understated over time.
Integrated equity fixes the problem by treating each year of a company’s retained earnings as a unique set of investments. It adjusts each year's earnings for inflation and then integrates the numbers back together to produce a cleaner measurement of book value.
While our focus in the past has been on book value as a flawed metric in need of adjusting, we’ve spent less time on earnings. Our new research indicates that the problems with book value cause earnings to be overstated. This happens because depreciation (which reduces earnings) is calculated relative to assets that are themselves understated on the balance sheet. As a result, depreciation becomes understated, which causes earnings to be overstated.
The tendency of earnings to be overstated suggests that free cash flow would be a better standalone measure of operating performance. We see that in the data. For example, in large cap stocks, free cash flow measures rise to the top of the pecking order when evaluated against other value factors for predicting future returns. Price-to-book, measured in the traditional fashion, comes in last. In the piece, we show that this conclusion holds true across different equity samples. Here 's the data for large cap stocks in the U.S.:
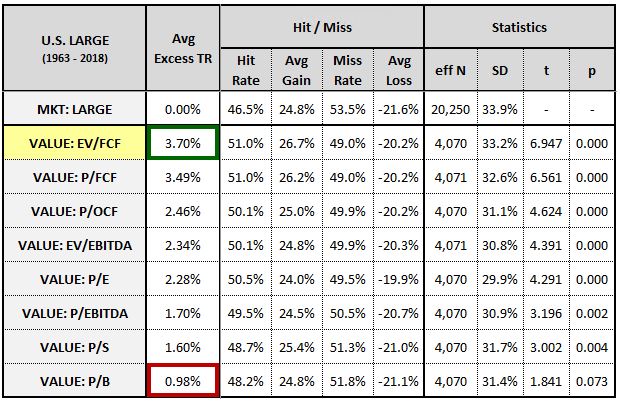
Free cash flow is effective not only in value metrics, but also in profitability metrics. As factors, return on equity and return on invested capital deliver higher returns when free cash flow is substituted in the place of earnings:
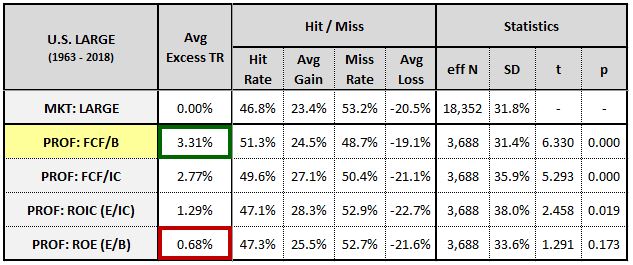
The evidence still suggests that a “composite” approach which blends many similar metrics together is the best way to implement a theme like value or profitability. But these findings are consistent with our long-standing practice of using free cash flow in our valuation methods. They've also prompted us to conduct additional research into how the use of free cash flow alongside earnings might fortify other factor techniques that we employ.
Share Buybacks
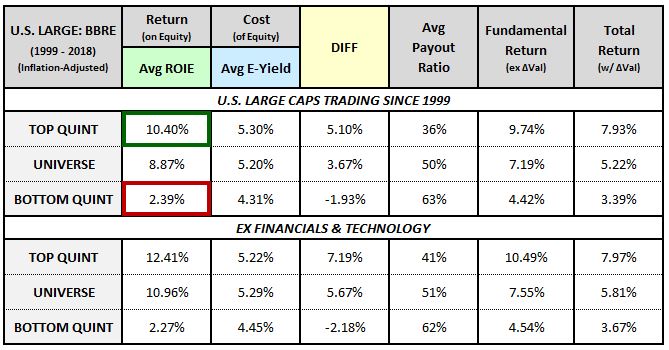
Buybacks are a capital allocation decision like any other. They can be good for shareholders or bad for shareholders, depending on the price the company pays. To further investigate buybacks and the firms that conduct them, we used the integrated equity methodology to study the profitability levels of high buyback firms relative to other firms. We found that high buyback companies exhibited higher levels of profitability, consistent with our prior research on the topic. The evidence continues to run counter to the narrative that buybacks are bad for shareholders, or are performed purely for the benefit of management1.
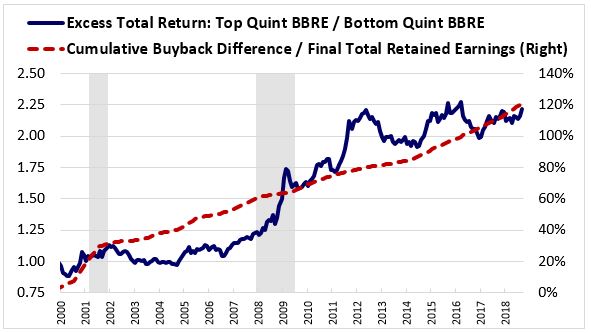
Granted, this is a single cohort of stocks and isn’t meant to be convincing evidence in favor of high buyback stocks on its own, but in this cohort, the trend is smooth and steady. The chart below shows the cumulative excess return (relative to low buyback stocks) of a cohort of high buyback firms between 1999 and 2018. The excess return (blue line) is steady through time, and tracks the difference in buyback amount (red line) between high and low buyback firms.
Buybacks continue to be an underappreciated, complimentary, and extremely useful signal in quantitative stock selection processes.
Stock Market Valuation: The P/IE Ratio
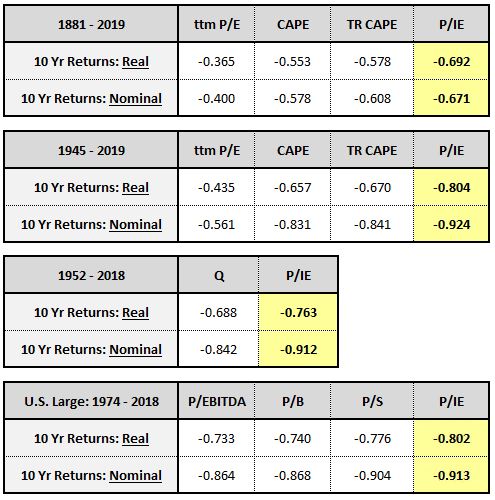
Perhaps the most interesting application of the integrated equity concept is in overall stock market valuation. When measuring the market’s valuation, non-cyclical measures such as Robert Shiller's CAPE ratio are frequently used to set future return expectations.
We tested the P/IE ratio, which is also a non-cyclical measure, against the CAPE and other popular metrics and found that it outperforms all of them, across a diverse collection of time periods:
Using the P/IE ratio, we can set long term strategic expectation for future U.S. equity returns:
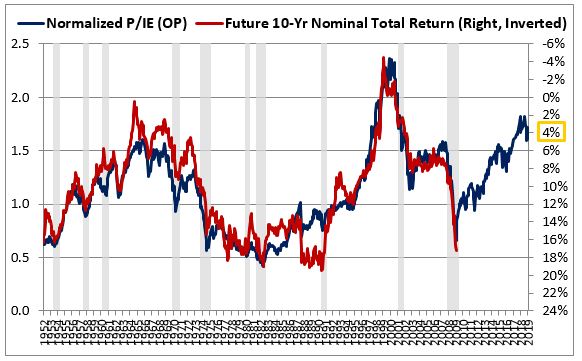
As of June, 2019, the estimate comes out to roughly 3-4% annualized—significantly lower than trailing 10-year returns and also lower than the long term historical average.
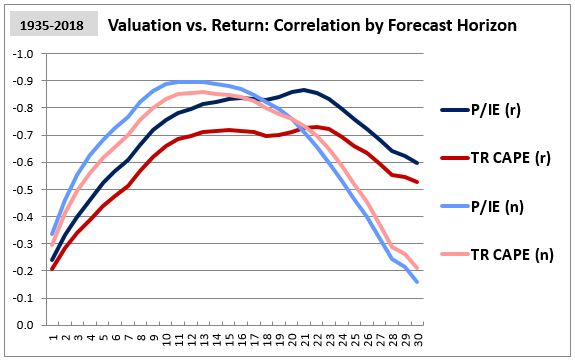
We need to acknowledge the limitations of such ratios. Their historical predictive power is only significant over long holding periods. The correlations between value and forward returns are high for forward periods between 10- and 20-years, but very low for shorter periods:
Conclusion
In working through the implications of the integrated equity method, we've fortified a number of our prior insights and have identified ways that we might be able to further strengthen our investment processes.
Above all, this project has demonstrated to me the importance of true cognitive diversity in our field. The work on this piece was primarily conducted by our partner, “Jesse Livermore+,” who does not work full time in finance or investing, but instead brings a highly unique set of skills and perspectives to common investing topics. The fact that the project yielded so much fruit is evidence of the power of fresh eyes. If you are interested in joining our research partners program, or if you know a good candidate, please let us know.
Whitepaper Links
Footnotes
1 If interested, read the detailed section on buybacks in Appendix E, which lays out the caveats to this argument.
General Legal Disclosures & Hypothetical and/or Backtested Results Disclaimer
The material contained herein is intended as a general market commentary. Opinions expressed herein are solely those of O’Shaughnessy Asset Management, LLC and may differ from those of your broker or investment firm.
Please remember that past performance may not be indicative of future results. Different types of investments involve varying degrees of risk, and there can be no assurance that the future performance of any specific investment, investment strategy, or product (including the investments and/or investment strategies recommended or undertaken by O’Shaughnessy Asset Management, LLC), or any non-investment related content, made reference to directly or indirectly in this piece will be profitable, equal any corresponding indicated historical performance level(s), be suitable for your portfolio or individual situation, or prove successful. Due to various factors, including changing market conditions and/or applicable laws, the content may no longer be reflective of current opinions or positions. Moreover, you should not assume that any discussion or information contained in this piece serves as the receipt of, or as a substitute for, personalized investment advice from O’Shaughnessy Asset Management, LLC. Any individual account performance information reflects the reinvestment of dividends (to the extent applicable), and is net of applicable transaction fees, O’Shaughnessy Asset Management, LLC’s investment management fee (if debited directly from the account), and any other related account expenses. Account information has been compiled solely by O’Shaughnessy Asset Management, LLC, has not been independently verified, and does not reflect the impact of taxes on non-qualified accounts. In preparing this report, O’Shaughnessy Asset Management, LLC has relied upon information provided by the account custodian. Please defer to formal tax documents received from the account custodian for cost basis and tax reporting purposes. Please remember to contact O’Shaughnessy Asset Management, LLC, in writing, if there are any changes in your personal/financial situation or investment objectives for the purpose of reviewing/evaluating/revising our previous recommendations and/or services, or if you want to impose, add, or modify any reasonable restrictions to our investment advisory services. Please Note: Unless you advise, in writing, to the contrary, we will assume that there are no restrictions on our services, other than to manage the account in accordance with your designated investment objective. Please Also Note: Please compare this statement with account statements received from the account custodian. The account custodian does not verify the accuracy of the advisory fee calculation. Please advise us if you have not been receiving monthly statements from the account custodian. Historical performance results for investment indices and/or categories have been provided for general comparison purposes only, and generally do not reflect the deduction of transaction and/or custodial charges, the deduction of an investment management fee, nor the impact of taxes, the incurrence of which would have the effect of decreasing historical performance results. It should not be assumed that your account holdings correspond directly to any comparative indices. To the extent that a reader has any questions regarding the applicability of any specific issue discussed above to his/her individual situation, he/she is encouraged to consult with the professional advisor of his/her choosing. O’Shaughnessy Asset Management, LLC is neither a law firm nor a certified public accounting firm and no portion of the newsletter content should be construed as legal or accounting advice. A copy of the O’Shaughnessy Asset Management, LLC’s current written disclosure statement discussing our advisory services and fees is available upon request.
Hypothetical performance results shown on the preceding pages are backtested and do not represent the performance of any account managed by OSAM, but were achieved by means of the retroactive application of each of the previously referenced models, certain aspects of which may have been designed with the benefit of hindsight.
The hypothetical backtested performance does not represent the results of actual trading using client assets nor decision-making during the period and does not and is not intended to indicate the past performance or future performance of any account or investment strategy managed by OSAM. If actual accounts had been managed throughout the period, ongoing research might have resulted in changes to the strategy which might have altered returns. The performance of any account or investment strategy managed by OSAM will differ from the hypothetical backtested performance results for each factor shown herein for a number of reasons, including without limitation the following:
▪ Although OSAM may consider from time to time one or more of the factors noted herein in managing any account, it may not consider all or any of such factors. OSAM may (and will) from time to time consider factors in addition to those noted herein in managing any account.
▪ OSAM may rebalance an account more frequently or less frequently than annually and at times other than presented herein.
▪ OSAM may from time to time manage an account by using non-quantitative, subjective investment management methodologies in conjunction with the application of factors.
▪ The hypothetical backtested performance results assume full investment, whereas an account managed by OSAM may have a positive cash position upon rebalance. Had the hypothetical backtested performance results included a positive cash position, the results would have been different and generally would have been lower.
▪ The hypothetical backtested performance results for each factor do not reflect any transaction costs of buying and selling securities, investment management fees (including without limitation management fees and performance fees), custody and other costs, or taxes – all of which would be incurred by an investor in any account managed by OSAM. If such costs and fees were reflected, the hypothetical backtested performance results would be lower.
▪ The hypothetical performance does not reflect the reinvestment of dividends and distributions therefrom, interest, capital gains and withholding taxes.
▪ Accounts managed by OSAM are subject to additions and redemptions of assets under management, which may positively or negatively affect performance depending generally upon the timing of such events in relation to the market’s direction.
▪ Simulated returns may be dependent on the market and economic conditions that existed during the period. Future market or economic conditions can adversely affect the returns.
Composite Performance Summary
For the full composite performance summaries, please follow this link: http://www.osam.com


