Appendix A: An Intuitive Example that Clarifies Important Claims Made in the Piece
By Jesse Livermore+
July 2019
In this Appendix, I'm going to explain and defend important claims made in the piece through the use of an intuitive example. The claims are listed in order below:
- Claim #1: Dividends and Buybacks are Functionally Equivalent as Pre-Tax Sources of Return
- Claim #2: To Sustainably Grow Real EPS Over Time, Corporations Needs to Invest Out of Retained Earnings
- Claim #3: The Corporate Sector's Average Earnings Yield is a Proxy for its Average Cost of Equity
- Claim #4: In a Historical Cost Framework, Reported ROEs will Rise, but they won't Normally Go to Infinity
- Claim #5: Depreciation is a Significant Source of Potential Error in Earnings Accounting
Example: ABC Capital
Suppose that a new company, called ABC Capital, is formed to invest in real estate. The company sells 500,000 shares at $100 per share, for a total of $50MM in initial capital raised. The company then borrows $150MM from creditors at a 5% interest rate. It uses the total proceeds, $200MM, to purchase land and fund the construction of a state-of-the-art 1,000 unit luxury apartment tower. Of this total cost, $20MM is apportioned to the cost of the land and $180MM is apportioned to the cost of constructing the tower, to include costs associated with design, regulatory approval, materials, equipment, construction and amenity purchases.
The table below shows the company's balance sheet after the tower investment:
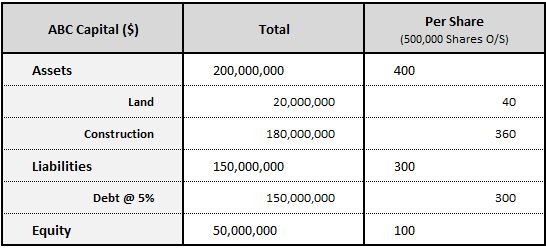
The tower consists of 1,000 individual apartment units, so the effective cost of each unit is $200K. The company charges $3,000 per month in rent for each unit and operates at 95% average occupancy.
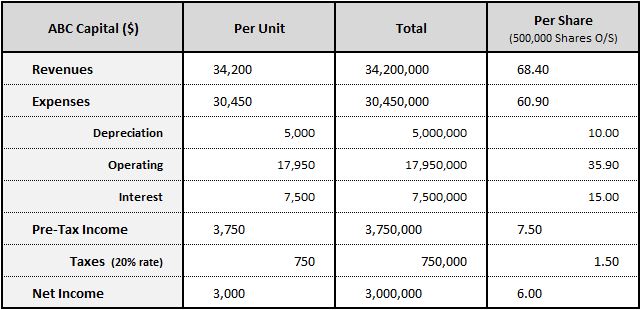
The table below shows the company's annual revenues and expenses on a per unit, total and per share basis:
The company's $20MM land investment is treated as a non-depreciating asset. The $180MM apportioned to the construction of the tower is depreciated down to a scrap value of $30MM on a straight-line basis using a 30-year useful life. This treatment reflects the assumption that if the company fails to make continuing investments in the tower, it will become uninhabitable, undesirable, or otherwise uncompetitive as a living destination in 30 years. The expected sale value of its remains at that time will be $30MM.
The total annual depreciation charge for the tower comes out to $5MM per year (= ($180MM - $30MM) / 30). This charge is meant to represent the expected cost of extending the tower's useful life by one year--the cost of upgrading and improving the tower's foundations, structures, amenities, facilities, interiors, systems, appliances, furniture and so on as they deteriorate and become obsolete over time. The company has to pay that cost in order to preserve the quality of the product that the tower delivers to its customers, which is the basis for its earnings power.
The tower's annual operating expense comes out to $17.95MM. This number covers all expenses that do not appreciably extend the tower's 30-year estimated useful life, to include management expenses, selling expenses, advertising expenses, cleaning expenses, utility expenses, expenses associated with the replacement of consumable items (e.g., air filters, lighting, etc.), ordinary and routine repair expenses, security expenses, recreational expenses, and so on.
After subtracting depreciation, operating expenses, and the interest expense on the debt (5% of $150MM = $7.5MM), the company earns pre-tax income of $3.75MM. The company is not classified as a REIT and pays effective federal and state corporate taxes at a rate of 20%, $750K per year. That leaves $3MM remaining in net income, $6 per share.
For the purpose of the example, let's assume that there's no inflation or cyclicality in the industry or broad economy in which ABC Capital operates, and that in each subsequent year out to infinity, the company will continue to earn exactly $3MM in net income. Let's assume further that the market is perfectly efficient, and that the company will always trade at a price equal to the value of its equity, also referred to as its book value, $100 per share. You buy 1,000 shares of the company, for a total personal investment of $100,000 and total annual earnings of $6,000. Those earnings will constitute the fundamental return on your investment.
Claim #1: Dividends and Buybacks are Functionally Equivalent as Pre-Tax Sources of Return
If the company's earnings are paid out to you as a dividend, you will receive $6 per share in cash each year. That $6 will represent a 6% return on the prior year's investment. But the $6 in cash is not going to continue to earn 6%. Once out of the fund, it will earn the cash rate. The table below shows what the trajectory of your investment will be under an assumed cash rate of 0%:
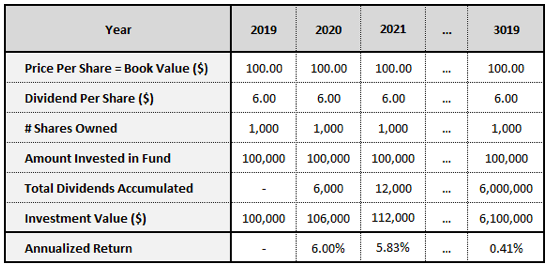
As you can see in the table, the overall investment will eventually turn into a large pool of accumulated cash dividends earning 0% and a relatively tiny stake in the fund earning 6%. The annualized return on the investment, measured from the 2019 start date, will therefore converge on the 0% return of the cash dividend pool.
For the overall investment to earn a 6% annualized return over the long-term, you will have to get each dividend back into the equity of the company. You can do that by reinvesting the dividends, using them to buy shares from other shareholders in the market.
If we assume that you reinvest your dividends at the $100 market price, the trajectory of your investment will play out as follows:
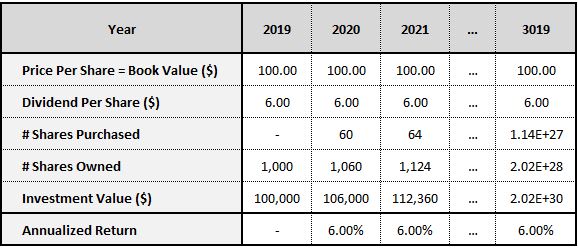
In theory, your total return will hold steady at 6% per year out to infinity. In practice, the reinvestment process will push you up against a supply wall. Eventually, there won't be any other shares for you to buy--you will own the entire company. At that point, the only way for you to continue to earn the annualized 6% will be for the company to stop paying the dividend to you and to instead invest it elsewhere at that rate.
In the example, you earn a 6% return because you use the dividends that you receive to purchase additional shares from shareholders that want to sell. Under current U.S. law, you realize a tax liability in this process--the dividends are immediately taxable at 15% or 20%, depending on your income level. If the company is optimally managed, it will prevent you from having to incur that liability by withholding the dividends from you and using the associated money to buy the shares for you, through the implementation of a share buyback program.
The table below shows what the trajectory of your investment will be if the company uses all of its earnings to buy back shares from shareholders that want to sell. The money used to repurchase shares will get removed from the company's equity via the treasury stock account, which is a contra account to the equity. At the same time, the company's outstanding share count will shrink, driving up all of its per share values, to include its price per share, assuming that the market is efficient:
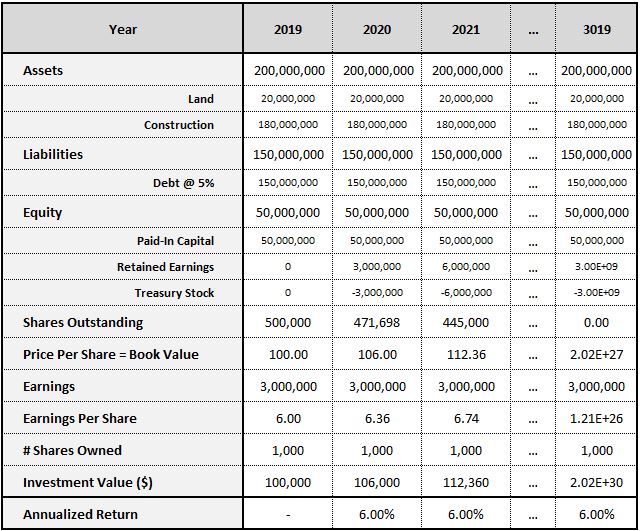
To form the table, we assume that the shares continue to trade exactly at book value, and that their prices rise after each fractional purchase to reflect the associated increase in book value caused by the purchase. Under this assumption, your overall return will end up being exactly the same as in the reinvested dividend case. Note that the 3019 number is purely theoretical--you will become the sole shareholder of the company long before that date arrives, at which point share buybacks will no longer be possible.
In the reinvested dividend case, the per share values of the company stayed constant, and your share count increased by 6% per year. In the share buyback case, the situation is reversed: the per share values of the company increase by 6% per year, and your share count stays constant.
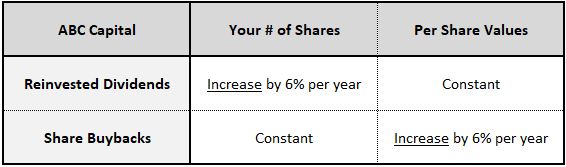
Either way, you end up in the same place. The reason you end up in the same place is that the action itself--the action of putting cash earnings back into equity by purchasing additional shares from exiting shareholders--is the same. Whether this action takes place inside the company, at the direction of management, or outside the company, at your direction, only matters to one thing: the taxes that you end up paying.
Claim #2: To Sustainably Grow Real EPS Over Time, Corporations Needs to Invest Out of Retained Earnings
On a cash basis, the ABC Company earns $16 per share each year. Of that amount, $10 is charged to depreciation, leaving $6 leftover as earnings. If the $10 depreciation expense is correctly stated, then, absent changes in the market, the company should be able to maintain $6 per share in earnings indefinitely into the future, even if it pays the entirety of those earnings out to shareholders as dividends. The entire point of calling the $6 "earnings" is to indicate that the company has gained something relative to its prior position. If the gain is real, the company should be able to distribute it to shareholders without suffering a decline relative to its prior position.
If a portion of the $6 has to be "invested" back into the apartment tower to preserve the company's current output, then the company's earnings have been overstated. The company's true earnings power is not $6--it's $6 minus the amount of additional required "investment." Similarly, if the company could sustainably maintain its current output capacity while distributing more than the $6 per share that it reports in earnings, then its earnings have been understated. Its true earnings power is $6 plus the extra distributable amount.
In the case of ABC Company, let's assume that the company's depreciation expense is accurately stated at $10. Let's assume further that the company makes no investments out of retained earnings, choosing to instead pay 100% of its earnings to shareholders as dividends. Under these assumptions, will it be possible for the company to grow its earnings over time?
Generally speaking, the answer is no. To grow its earnings, the company needs to grow its revenues. To grow its revenues, it needs to rent out more apartments. Since it doesn't have any more apartments to rent out, it needs to devote a portion of its earnings to the construction or acquisition of additional apartments. It can't do that if it's paying out the entirety of its earnings as dividends.
To be fair, this claim requires qualification. There are a number of possible paths through which the company can grow its earnings in the absence of earnings reinvestment. But these paths are trivial and cannot be utilized by the corporate sector as a whole, at least not over the long-run. Let's examine each path individually:
- Equity Issuance - Trivially, the company can grow its earnings by raising new equity capital, using the proceeds to invest in new towers. Technically, this move will allow the company to keep paying out all of its earnings as dividends. But if it continues to trade at its book value, and if it invests the new equity capital at the same ROE that its existing equity is generating, then the earnings boost that it gets from the new towers will be exactly offset by the share count increase that it suffers as a result of the equity issuance, leaving its earnings per share--the metric that shareholders actually care about--unchanged.
- Price Increases -- The company can grow its earnings by raising its prices. Instead of charging $3,000 a month for rent, for example, it can charge $4,000. If the demand for its apartment offerings is sufficiently strong, then it will be able to maintain high occupancy at this higher price point, generating higher revenue and therefore higher earnings. But this mode of earnings growth is only available to individual partitions of the economy--individual companies, industries, and so on. It's not available to the corporate sector as a whole because if the corporate sector raises its prices, the higher prices will lead to a higher consumer price index (CPI), which is a weighted average of all prices in the economy. The CPI increase will offset the associated growth in the corporate sector's earnings, yielding no real growth.1
- Expense Reduction -- The company can experience growth in its earnings through a reduction in its wage, interest and tax expenses. But there's a limit to how low its expenses can go. They can't go below zero, for example. Ultimately, the corporate sector's expenses represent income for other sectors of the economy. If those expenses are substantially reduced, the other sectors will be deprived of the income needed to purchase the corporate sector's output. The result will be weakness in revenues, offsetting the benefit from lower expenses.
- Increased Leverage -- The company can grow its earnings by increasing its leverage. If the interest rate charged on its debt is lower than the rate of return that it generates on its investments before interest and taxes, then it can boost its earnings by taking on additional debt. But there's a limit to the amount of additional debt that it can safely and sustainably take on. Credit investors will enforce that limit through the interest rates that they charge.
- Improved Capacity Utilization -- If a company has idle capacity, it can experience earnings growth through the increased utilization of that capacity over time. Suppose, for example, that the apartment tower has a large number of rooms to rent out because it was recently constructed and is not yet well known in the community. As word gets out about the quality of the living experience that it's offering, its idle capacity will fill up and its sales and earnings will grow. This growth will not require any further investment. The point is trivial, however, because the idle capacity that the company will be selling to achieve the growth will have been the result of prior investments that it made. Those investments had not yet been utilized, and so the growth had not yet shown up.2
- Copying Innovation - Innovation comes at a cost--the cost of research and development. After someone has paid that cost and developed an innovation, others can often copy it, sometimes free of charge. This does not represent an investment-free path to growth, however, because the copying process requires outlays. To convert a copied idea into actual output, money has to be invested into it.
For the overall corporate sector, none of these options represent sustainable, investment-free paths to real earnings per share (EPS) growth. Even if one of the options did represent such a path, a barrier would be needed to prevent everyone from taking that path, driving profitability down through competition. In a capitalist economy, the barrier that prevents everyone from partaking in available growth opportunities is the fact that they require you to make an investment, which comes at the cost of a deferral of your consumption, a reduction in your liquidity, and the risk of a permanent loss of your capital.
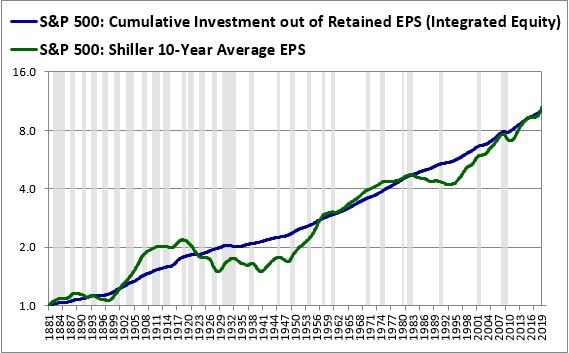
The relationship between real growth per share and retained earnings investment is corroborated in the historical data. Over the last 148 years, the U.S. corporate sector's real EPS growth has tracked very closely with the total amount that it has invested out of retained earnings. On a long-term basis, there hasn't been any "extra" real growth from equity issuance, price increases, increased leverage, expense reduction, improved capacity utilization, or the copying of innovation:
Claim #3: The Corporate Sector's Average Earnings Yield is a Proxy for its Average Cost of Equity
We can define "fundamental return" as the return generated from fundamentals, i.e., growth (in EPS) and income (dividends). Let's suppose that the corporate sector uses all of its earnings over a given period to buy back its own shares at market prices (and cancel them). What will its average fundamental return over the period be?
The mathematical answer is that its average fundamental return will be whatever its average earnings yield over the period was. That's because each fractional repurchase that it makes will cause its share count to drop and its EPS to rise by the percentage of its price that the repurchase represents. Since all of its earnings are being used to repurchase shares, this percentage will just equal its earnings divided by its price, i.e., its earnings yield. Its EPS will end up growing at the rate of its earnings yield, and that growth will constitute its fundamental return.
To illustrate the point using actual numbers, suppose that the corporate sector trades at a steady 6% earnings yield, which means that it earns 6% of its price each year. If it takes all of that money and buys back shares, it will increase its EPS each year by the same percentage, 6%. Its EPS will therefore grow at a 6% rate. Since it won't be paying any dividends, its dividend return will be 0%. Similarly, since it won't be making any investments out of retained EPS, it won't (sustainably) get any extra return from growth. It will therefore end up with an average fundamental return of 6%, equal to its 6% average earnings yield.
To understand why we focus on the average earnings yield in this context, suppose that we're working with a collection of time periods of equal size. If we raise the corporate sector's price in a given period, so that its earnings yield drops to 4%, and then we lower its price in the next period, so that its earnings yield rises to 10%, and then we raise its price in the period after that, so that its earnings yield falls back down to 6%, and so on, deploying 100% of its earnings into share buybacks in each period, each purchase will generate an annualized rate of return equal to the average earnings yield in that period. As we buy back shares across all the periods, we're going to generate an overall return equal to the geometric average of all the different annualized rates of return, i.e., the geometric average of all the different earnings yields.
Now, the term "cost of equity" is hard to pin down and can be defined in a number of different ways. We're going to define it in a very specific way. A company's cost of equity is the current cost to the company of issuing new shares. This cost assumes that the company's equity will forever remain exactly where it currently is--that it won't experience any future investment-related increases.
To complete the argument, if the average earnings yield of the overall corporate sector equals the average fundamental return that it earns when it uses all of its earnings to buy back shares (and cancel them), then, by symmetry, the corporate sector's average earnings yield must also equal the average cost that it incurs when it does the opposite: issues new shares. Per our definition, that cost is the corporate sector's cost of equity. We can therefore equate the corporate sector's average earnings yield with its average cost of equity over time.
Claim #4: In a Historical Cost Framework, Reported ROEs will Rise, but they won't Normally Go to Infinity
In our example, we assumed that ABC Capital operated in an economy with zero inflation. To switch things up, let's now assume that the company operates in an economy with positive inflation. If the company is an average company, then its nominal rent prices will tend to rise over time at the rate of inflation. The increases in its rent prices will allow its nominal earnings to grow in the absence of investment. But they won't lead to proportionate growth in the company's reported book value, because book values are reported at historical cost. The ratio of the company's nominal earnings to its reported book value, otherwise known as its return on equity (ROE), will therefore increase over time.
How high will the company's ROE go? Will it go to infinity? Surprisingly, the answer depends on the company's dividend payout ratio. If the company reinvests any portion of its retained earnings, then its reported ROE will eventually stop increasing, equilibrating at some artificially elevated value. But if the company does not reinvest any portion of its retained earnings--that is, if it implements a payout ratio of 100%--then its reported ROE will rise forever, all the way up to infinity. I lay out the mathematics behind this result in the text below.
In the absence of adjustments for inflation, the ROE of a company will rise and will reach equilibrium when its rate of nominal earnings (E) growth equals its rate of nominal book value (BV) growth. At that point, the numerator and the denominator in the expression of ROE will be growing at the same rate, allowing the ROE to stay constant. So, as an equilibrium ROE condition, we have:
(1) Rate of E Growth = Rate of BV Growth
Now, the rate of BV growth is just:
(2) Rate of BV Growth = (BV + ΔBV) / BV
where ΔBV is the change in book value. But the change in book value is simply retained earnings. We can therefore write ΔBV as:
(3) ΔBV = Retained Earnings = Earnings * (1 - Payout Ratio)
Inserting (3) into (2) we get:
(4) Rate of BV Growth = (BV + Earnings * (1 - Payout Ratio)) / BV
Mathematically, BV is just (Earnings / ROE). Substituting that fact into (4), we get:
(5) Rate of BV Growth = (Earnings / ROE + Earnings * (1 - Payout Ratio)) / (Earnings / ROE)
Dividing the numerator by (Earnings / ROE), we get:
(6) Rate of BV Growth = 1 + ROE * (1 - Payout Ratio))
If G is the annualized percentage change in nominal earnings, then the nominal earnings growth rate expressed in a form consistent with (2) is:
(7) Rate of E Growth = 1 + G
Combining (1), (6) and (7), and solving for ROE, we get:
(8) ROE = G / (1 - Payout Ratio)
This equation specifies the equilibrium value that ROE will rise to in an inflation-unadjusted historical cost accounting framework.
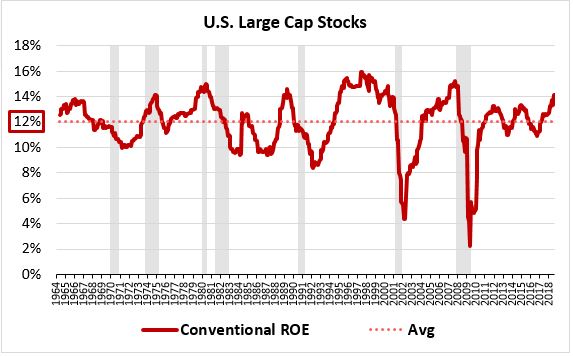
To check the equation, we can see if it yields a result that fits with the actual reported ROE of U.S. Large Cap Stocks. From 1964 to 2018, the annual percentage change in nominal earnings for U.S. Large Cap Stocks, which is the variable G in the equation, was 6.29% per year. The average dividend payout ratio was 51.49%. Plugging these numbers into the equation we get:
(9) ROE = 6.29% / (1 - 51.49%) = 12.96%
The actual reported ROE for the period was 12.02%--on par with the number predicted by the equation:
To answer the earlier question, the equation for equilibrium ROE given in (8) tells us that the ROE will only go to infinity if the dividend payout ratio is 100%. This conclusion makes intuitive sense. If a company pays out all of its earnings as dividends, it won't have any retained earnings, and therefore its reported book value won't ever grow. With its earnings growing on pace with inflation, and its reported book value stuck at a constant, unchanging value, the ratio between its earnings and its reported book value, i.e., its ROE, will increase forever.
Now, if a company does invest out of retained earnings, its reported book value will tend to grow over time. The rate of growth of will be determined by the amount of earnings that the company retains relative to its reported book value. As its nominal earnings grow with inflation over time, this amount will get larger, causing its reported book value to grow at a faster pace. Eventually, the rate of growth of its reported book value will come to equal the rate of growth of its nominal earnings, at which point the equilibrium specified in (8) will have been reached. The ROE will then stop increasing.
Claim #5: Depreciation is a Significant Source of Error in Earnings Accounting
As the tower ages over time, it's going to lose value as a place to live. This "loss" will represent a real loss to the company. From an accounting perspective, it gets captured in the company's $5MM annual depreciation expense, a non-cash expense that reduces the company's earnings.
Because the company is incurring a $5MM annual depreciation charge, the money that it spends on the upkeep of the tower does not get deducted from revenue as an expense. Instead, the company "capitalizes" it, i.e., adds it to the balance sheet as a new investment. The justification for capitalizing it is that the loss associated with the tower's depreciation has already been counted in the $5MM charge. To treat the cost of reversing that loss as an additional expense would be to count the underlying loss twice.
Depreciation is an extremely important expense in the calculation of net income. This is true not just for apartments, but for all corporate assets. Historically, the average annual depreciation expense incurred by large cap stocks has been around 5% of sales. That's roughly the same percentage as net income itself, which has also averaged out to around 5% of sales. On average, then, each percentage change in the depreciation charge translates into a similar percentage change in actual earnings.
Given the importance of depreciation as an expense in the corporate sector's cost structure, it's crucial that the expense be represented correctly. Unfortunately, the way in which it's represented under prevailing accounting rules introduces a significant risk of error. The expense doesn't actually get measured empirically, but is instead estimated using various accounting thumbrules: a 5-year useful life for this type of asset, a 10-year useful life for that type of asset, and so on. These thumbrules result from industry conventions rather than from rigorous examinations of the assets themselves. It's therefore easy for them to turn out to be wrong.
In the tower example, we arrived at the $5MM number by assigning a 30-year useful life to the tower. How do we know that 30 years is the right number to use? Why not 20 years? Why not 40 years? The truth is that we could have used either of these numbers, or some other number. Our basis for doing so would have been just as strong as our basis for using the number 30.
If we had used 20 years instead of 30 years, our annual depreciation expense would have come out to $7.5MM rather than $5MM. Our pre-tax earnings would have fallen from $3.75MM to $1.25MM, a 66% drop, all from the arbitrary choice of a different thumbrule.
To be fair, depreciation is a difficult expense to accurately capture in real estate, so the example that we've offered here represents a worst-case example. But the underlying problem extends to all industries. There's no reliable way to empirically measure deprecation, no reliable way to get immediate feedback when it's measured incorrectly, and therefore no reliable way to detect and correct earnings misstatements associated with it. This is a problem because corporations have a strong incentive to understate depreciation where they can. In doing so, they make their earnings performances look stronger. The market then rewards them with higher stock prices.
In the case of real estate, the prevalent accounting thumbrules probably overstate depreciation. Since real estate is an important component of the corporate sector's asset base, it's plausible to think (hope?) that this overstatement would offset the corporate sector's natural incentive to understate depreciation in other contexts, leaving us with an earnings measure that's generally accurate in the aggregate.
Unfortunately, there's a bigger problem to worry about with respect to the way depreciation is calculated: the problem of inflation. Recall that U.S. GAAP requires companies to calculate depreciation using the historical costs of their assets as the starting basis. As prices in the economy inflate over time, these costs become understated in current price terms. The actual costs of preserving the assets and extending their useful lives ends up rising, but the depreciation expenses that are meant to capture those costs stay constant, since they're tied to the initial values of the assets, values that cannot be upwardly-adjusted in GAAP. Consequently, the depreciation charges end up being systematically understated in the presence of inflation, leading to the systematic overstatement of earnings. We discuss this overstatement in more detail in Section 4 and Appendix F.
Whitepaper Links
Footnotes
1 To be fair, if the corporate sector manages to increase its prices by more than its expenses, then it will experience earnings growth in excess of inflation. But in this process, it will simply be taking a share of real output away from the other sectors of the economy, an approach that is unsustainable in the long run.
2 Even in rare cases where a company seems to have an infinite and apparently free supply of a product to offer−think Facebook and its social network−the existence of that supply will have been the result of a prior investment. In Facebook's case, the prior investment was the build-out of the infrastructure for the social network. Given the “winner take all” nature of social network businesses, the investment became hyper-profitable, allowing the company to grow its earnings years and decades into the future, without requiring large, costly additional investments. Obviously, the level of profitability that Facebook managed to generate on its initial investment is the exception, not the rule.


