Appendix G: Initial Equity in the PIE Ratio Calculation
By Jesse Livermore+
July 2019
When we test the ability of the P/IE metric to forecast future returns, we're technically exposing ourselves to a small amount of look-ahead bias. In this Appendix, I'm going to explain why that bias is not a problem for the testing process.
To understand where the bias comes from, recall that the methodology estimates the initial equity value of a company or index using a calibration technique that incorporates data from the future (see Appendix B for details). If our goal is to conduct a historical analysis of profitability, then using future data to make an initial equity estimate is fine. But if our goal is to test the predictive power of the ensuing measure, then we can't allow it to have access to that data.
The table below shows the correlations between S&P 500 P/IE ratios constructed on different initial 1871 equity value assignments and future 10-year S&P 500 returns. A more negative correlation means a stronger relationship:
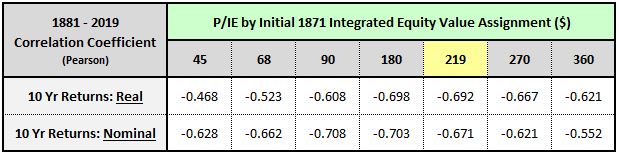
Recall that when we were applying the methodology to the S&P 500, we didn't know what the S&P 500's initial 1871 book value was. We therefore needed to estimate it. Using the calibration technique described in Appendix C, we arrived at an initial estimate of $219 (in 2018 dollars). As the chart confirms, the real return correlations, which are the return correlations that matter most in the test, get stronger when we build metrics with initial equity values that are close to that value. This isn't a surprise--the correlations get stronger because the initial 1871 estimate is very close to the actual true 1871 value. But we can only know that by looking into the future, which we're not allowed to do in a predictive test.
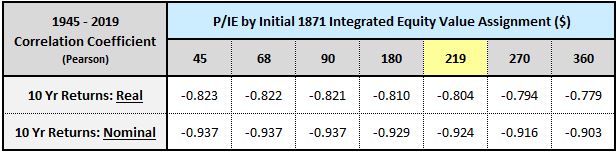
Fortunately, when we constrain the analysis to the periods of market history that we're actually concerned about, e.g., the post-war periods from 1945 to present, any perceptible benefits of the look-ahead bias disappear. In fact, other initial assignments end up doing slightly better than our calibrated $219 choice:
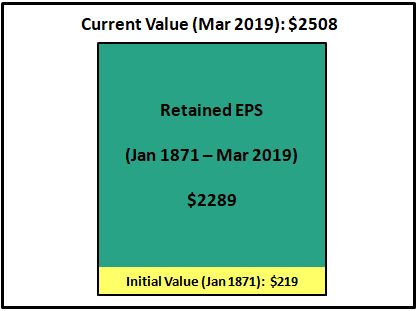
The reason the benefits disappear is that the contribution of the initial 1871 equity value to subsequent equity values becomes increasingly small and irrelevant as the index grows in size from its initial date. As the image below illustrates, the retained EPS becomes the overwhelmingly dominant contributor to the total equity sum, with the contribution of the initial equity value estimate shrinking in comparison. If we wanted to, we could even set the assumed initial 1871 equity value to zero. The current integrated equity value would only change by 8.7% (=$219 / $2508).
Consequently, we don't need to worry about the small amount of look-ahead bias that the calibration technique might introduce. To the extent that this bias exists, it's miniscule, and plays no role at all in driving the metric's predictive strength over the periods of market history that we're interested in.
Whitepaper Links


