Why Fundamentals Matter
By Jamie Catherwood
August 2022
Share prices and investors’ interest in fundamentals often have an inverse relationship over shorter timeframes.
In speculative periods when stock prices soar, investors frequently ignore the underlying earnings, balance sheets, etc. of stocks they own. Instead, recent price momentum dictates investors’ buy/sell decisions. Thus, a rising stock price alone is often enough justification to warrant buying shares.
While there are few long-term winners in such environments, the reduced focus on critical details like earnings and valuation benefits the type of company that usually captures investor enthusiasm during speculative booms. These companies are generally unprofitable, have vague financials, and trade at high valuations. Yet, they usually do have exciting narratives about technological innovation, disruption, and future earnings.
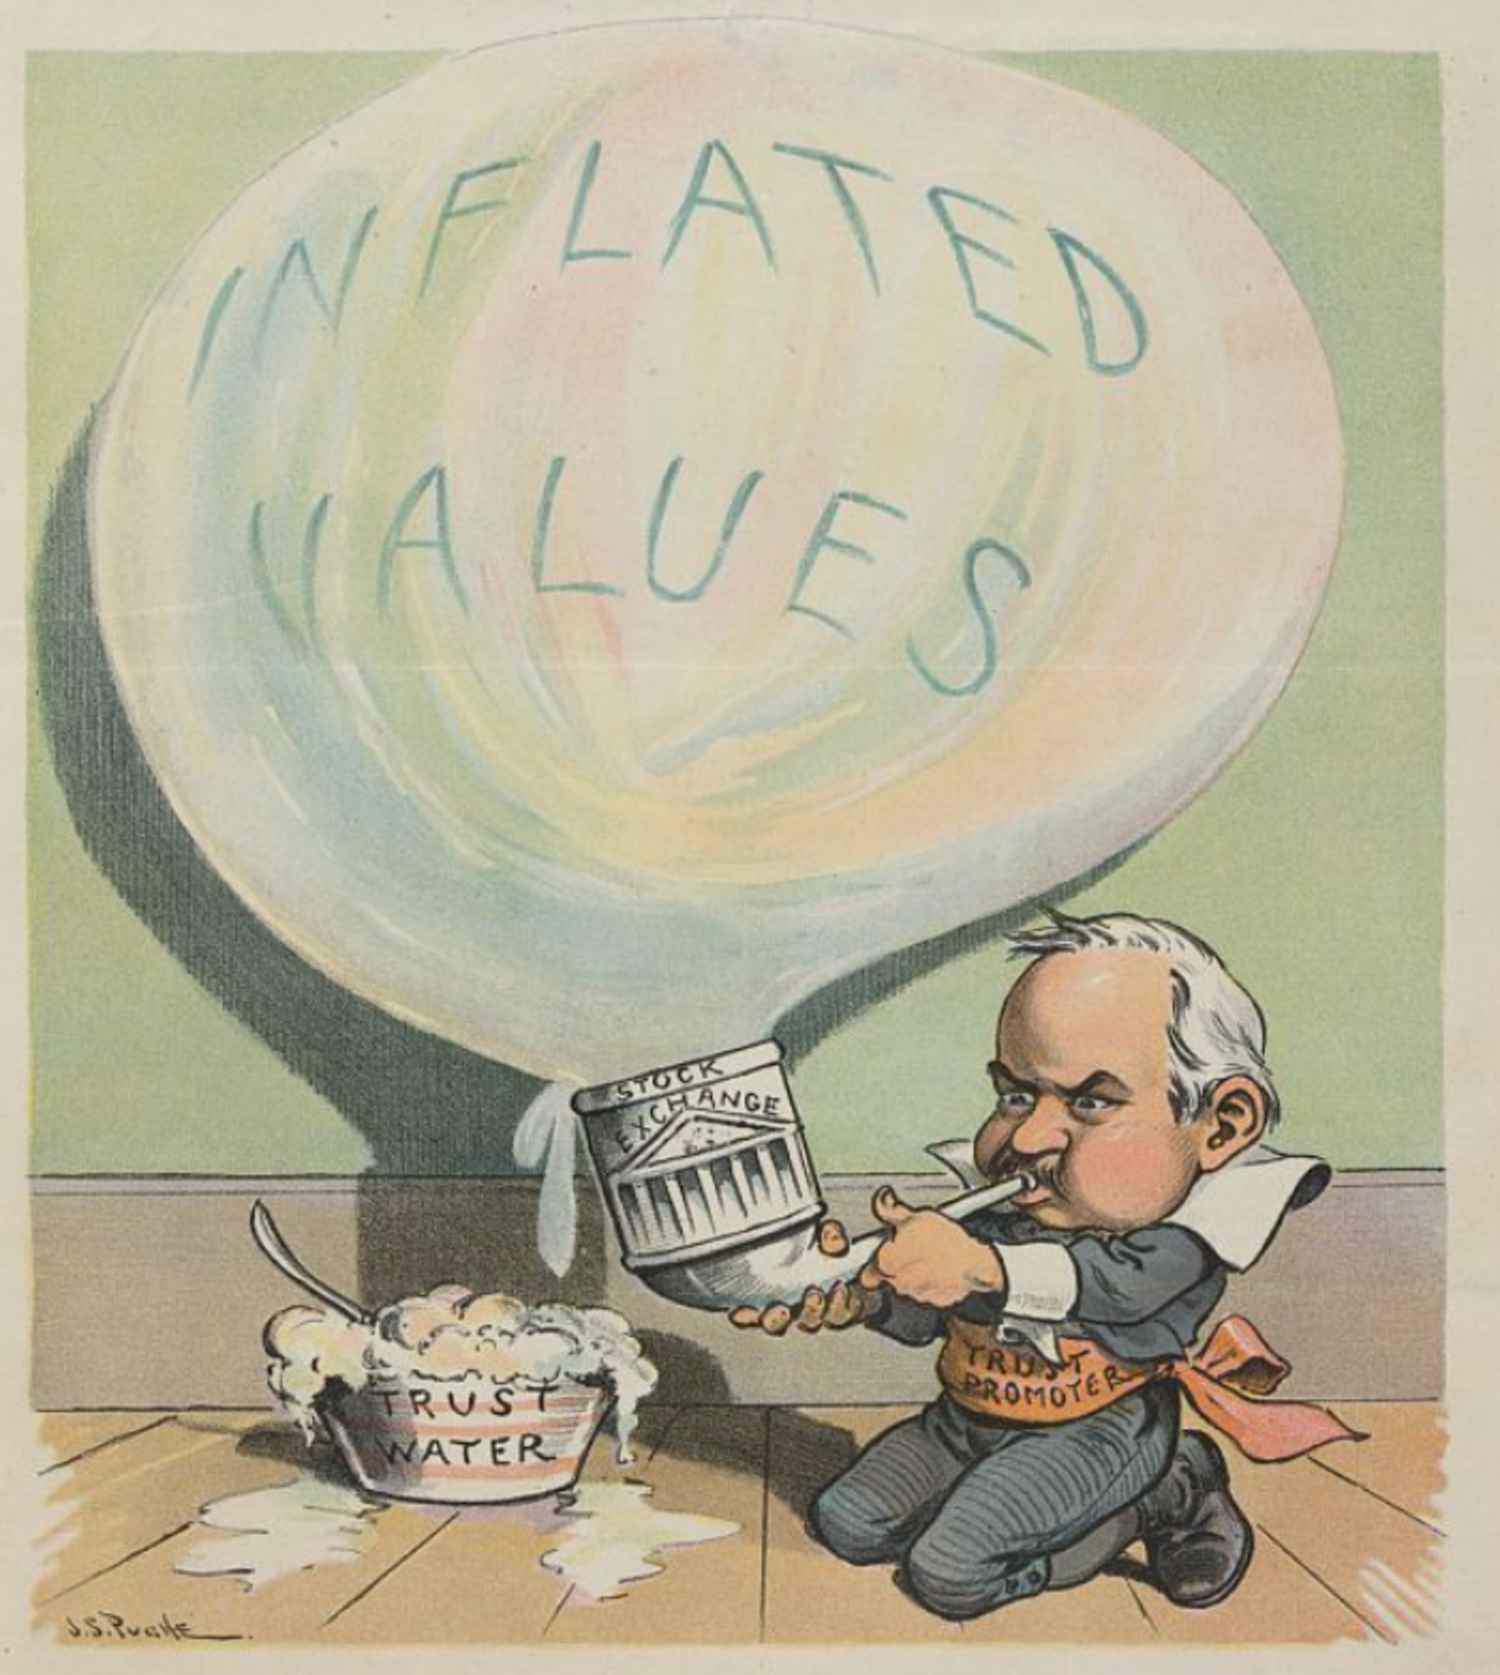
VAGUE FINANCIALS & VAGUER FUTURES
One advantage that these unprofitable companies arguably have is that without existing profits, it’s impossible to compare the practicality of future profit projections.
In Simple Principles of Investment, published in 1919, the author joked:
"If there is nothing to compare, there is nothing to criticize."
Consequently, companies in this camp have more “gray area” to stir up enthusiasm, as it’s harder to disprove the feasibility of their narratives and projections. As a result, without actual profits, the company narrative becomes increasingly important for attracting capital.
How is this executed in practice? Well, some approaches have barely changed in more than a century:
“One of the principal reasons why people hazard their funds in these so-called [speculative] securities is that there are a few instances where such ventures have proved highly profitable from the start, and the promoters are adept in stressing and emphasizing these exceptional cases...
Corporations load their prospectuses with figures showing the great profits that could have been made by buying Standard Oil or General Motors at ground-floor prices, concluding with confident predictions that their particular ventures will duplicate these performances – which they never do.”1
The Role of Cheap Money
The problems outlined above are only exacerbated by supportive monetary policy. First, low interest rates and cheap financing enables more speculative enterprises to form. Second, since many investors must re-allocate capital from low-yielding assets to riskier investments, these speculative companies attract investors with exciting narratives and promises of future growth.
An investing book from 1873 described how a “flood of paper money [credit] poured from the steam presses”, which “sufficed now to float all kinds of speculative enterprises.”2
Should the share prices of speculative companies go higher, a feedback loop forms in which rising share prices encourage more speculation, which raises share prices, and so forth.
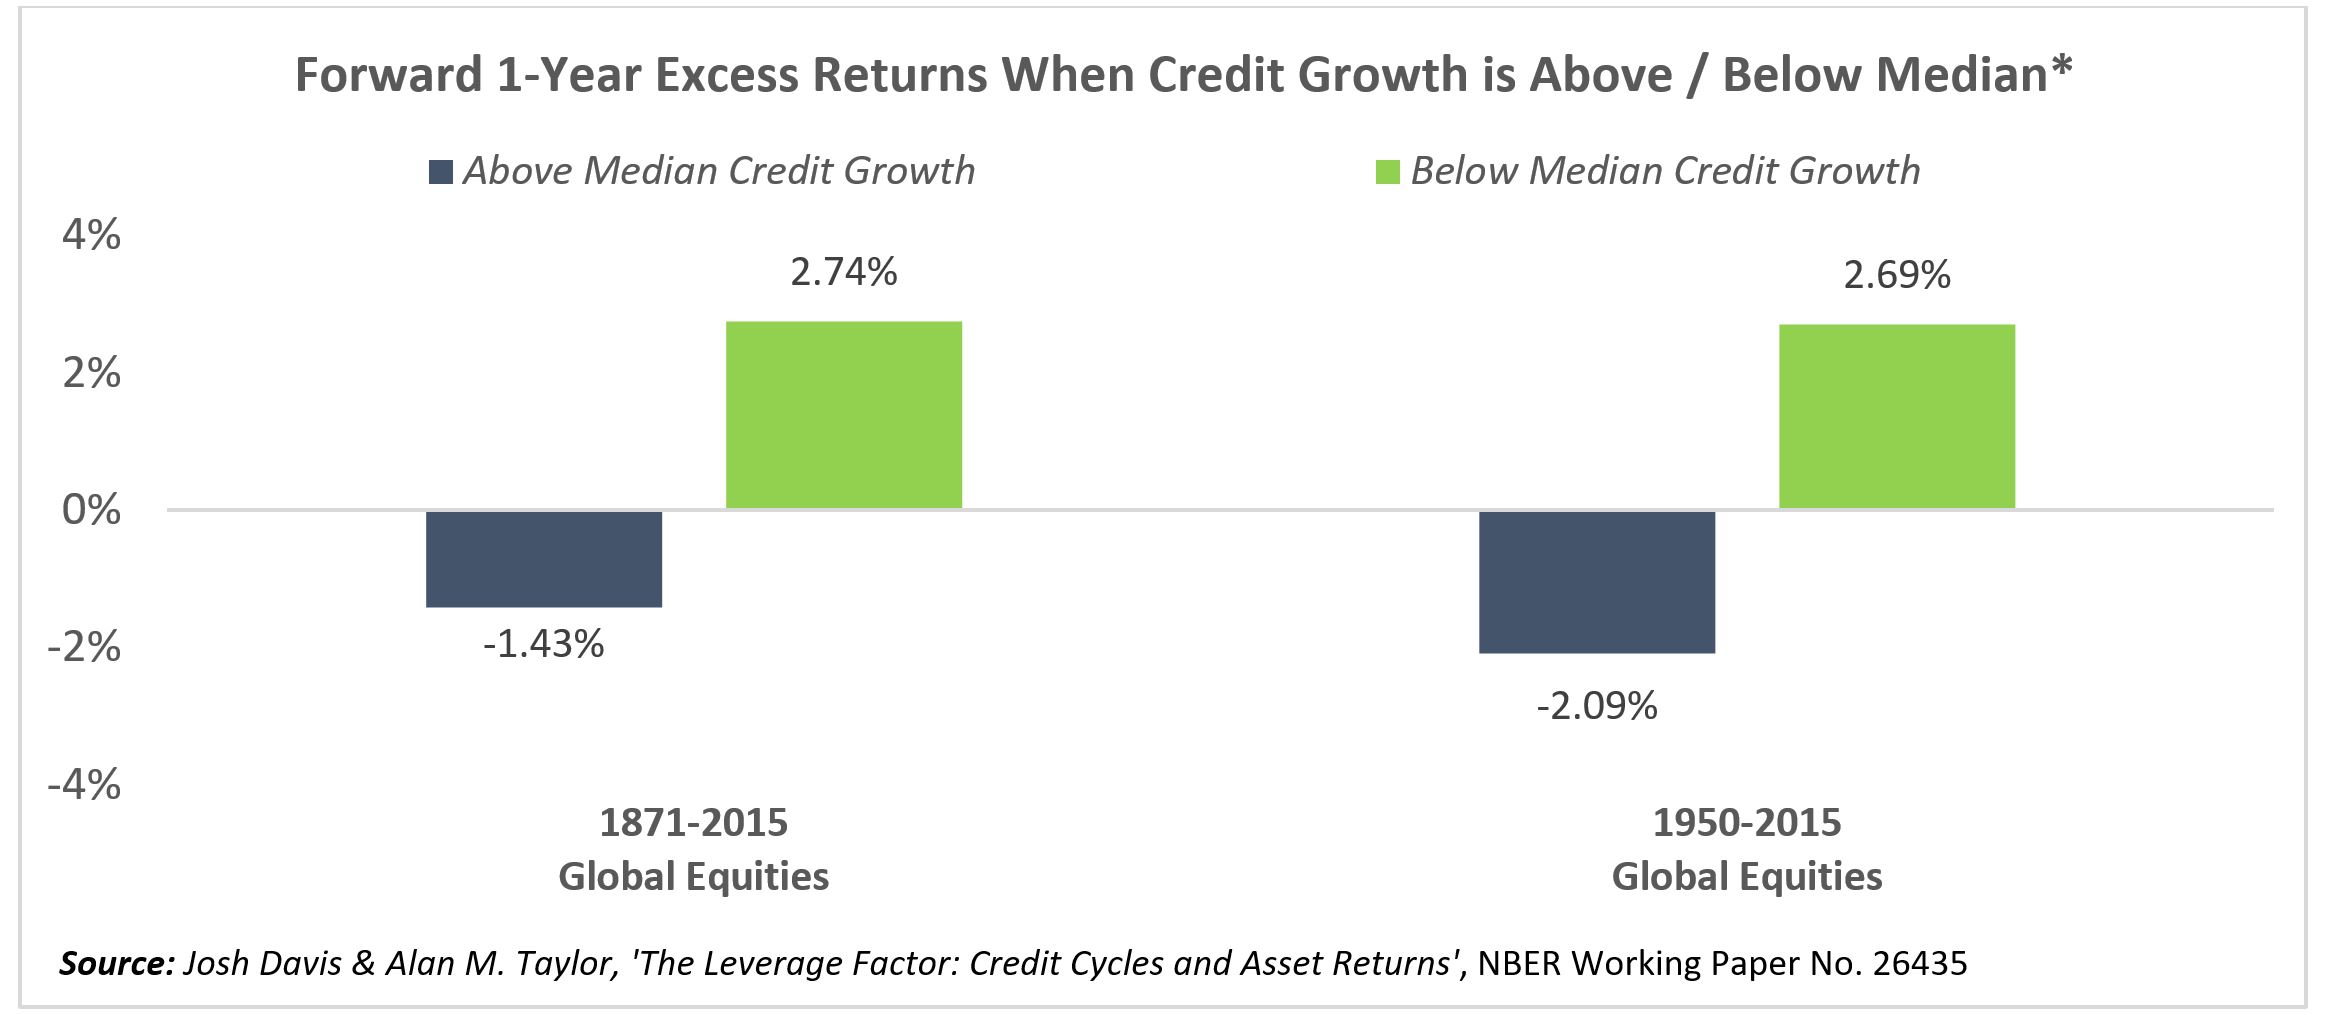
Before long, however, the market reaches a state like that characterized by the Spectator Magazine in 1896: “[an] inflated and flabby condition caused by a diet of cheap money.”
In the chart below, one can clearly see how credit booms negatively impact future equity returns.
THE IMPORTANCE OF FUNDAMENTALS
The problems for speculative companies and their shareholders begin when markets fall and enthusiasm wanes. While a powerful narrative and forecast of future profits can temporarily drive share prices higher, these are not sustainable sources of long-term performance.
Eventually, every company is a business, and every business needs profits. To that end, our research highlights three enduring drivers of long-term market returns:
- Business Growth – The earnings of the business increase over time.
- Return of Capital – Management returns cash to shareholders via buybacks, dividends, or both.
- Multiple Expansion – Investors become willing to pay more for each $1 in earnings (Higher P/E Ratio).
This chart below quantifies the impact of each component on the S&P 500 Composite’s returns since 1871 (i.e., Earnings Growth drove 45% of the S&P 500 Composite’s total return since 1871).
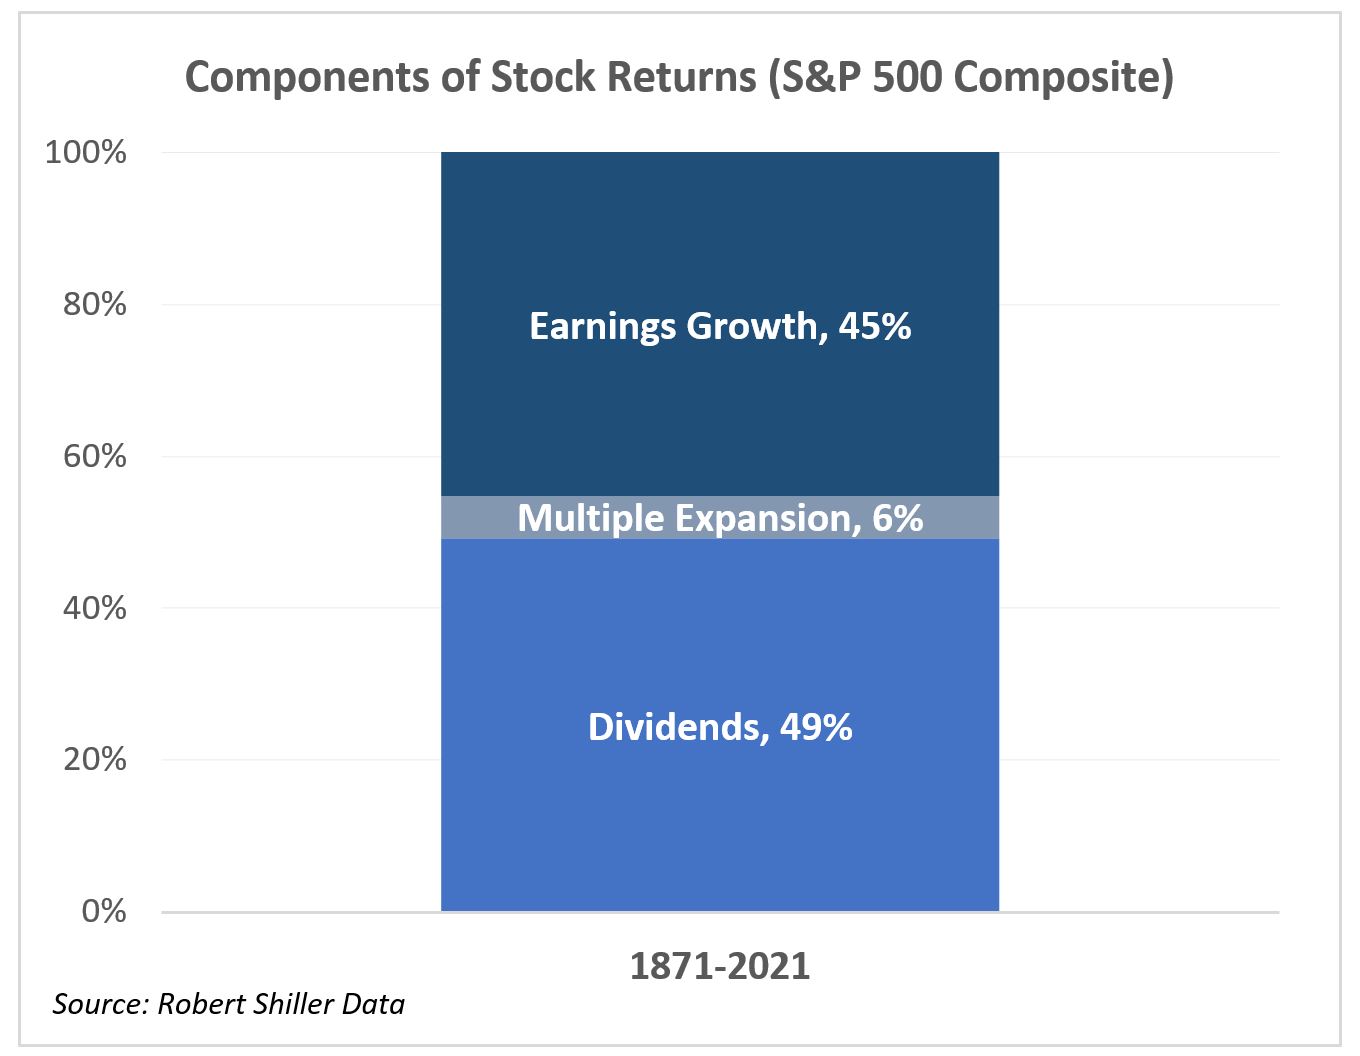 Interestingly, from 1871 – 2021, Multiple Expansion was responsible for just 6% of the S&P 500 Composite’s return. Again, Multiple Expansion simply reflects the willingness of investors to pay more for each $1 in earnings that a company generates (in other words, buy stocks at a higher P/E multiple).
Why would an investor decide to pay more money for the same amount of earnings?
The answer lies in the investor’s expectation that future earnings growth will justify the current (high) valuation. Unfortunately, humans have a very poor track record in predicting the future. Consequently, projections of future earnings tend to be overly optimistic.
However, this also explains why companies with less robust fundamentals (i.e., earnings growth) emphasize intangible things like narrative and future disruption / innovation. Done well, these intangible items can entice enthusiastic investors into paying a higher earnings multiple for their stock.
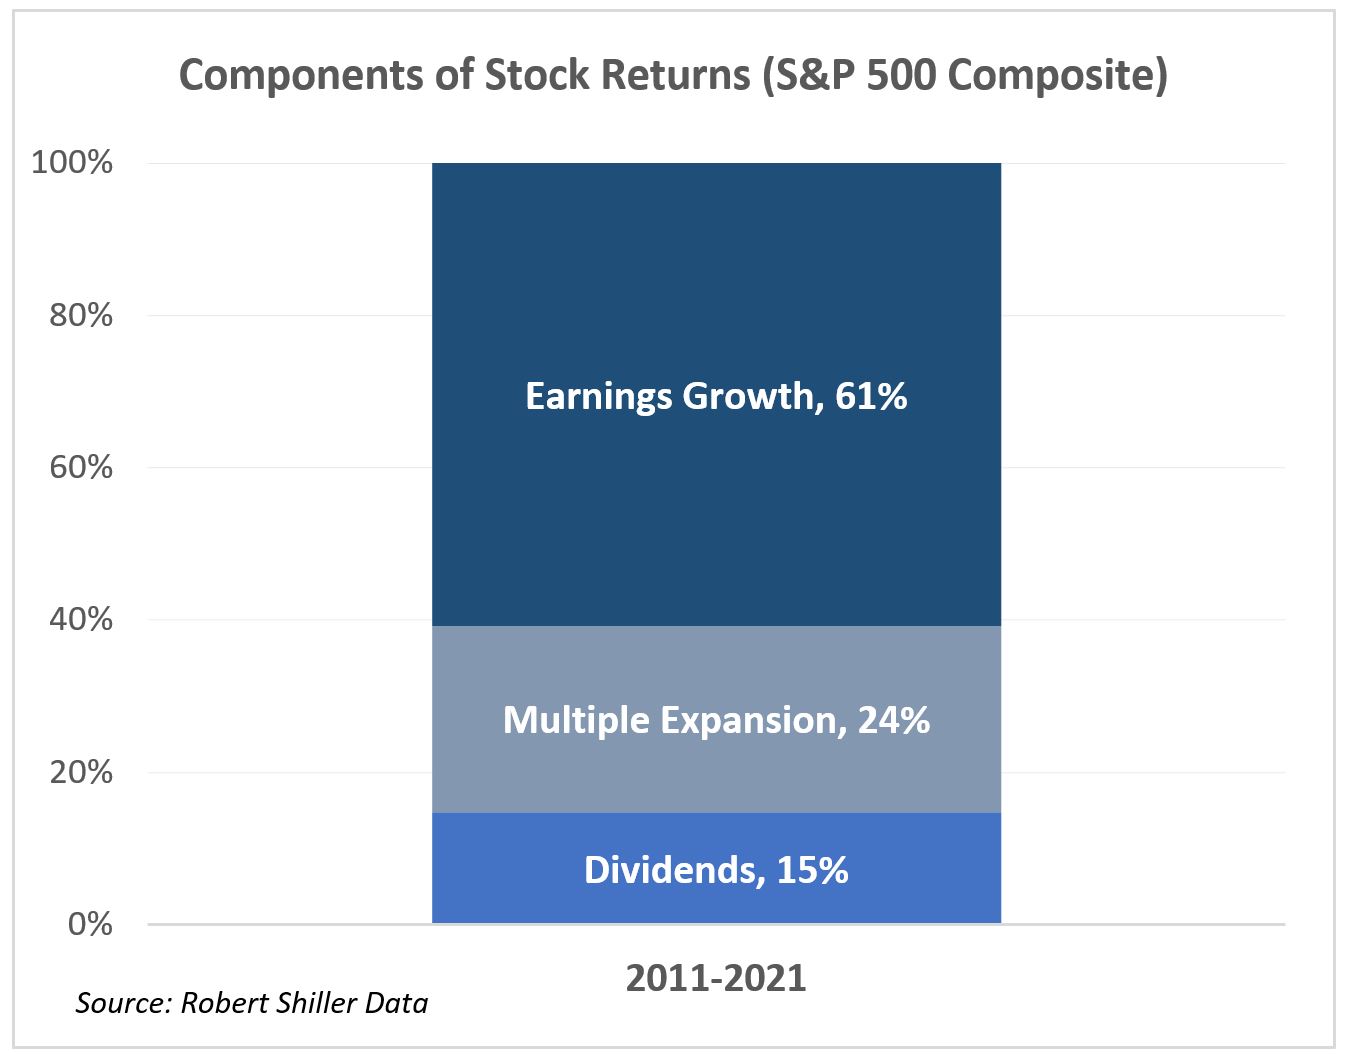
The Increasing Importance of Multiple Expansion
Although Multiple Expansion only accounted for 6% of the S&P 500 Composite’s total return between 1871 – 2021, that figure has risen to 24% over the last decade.
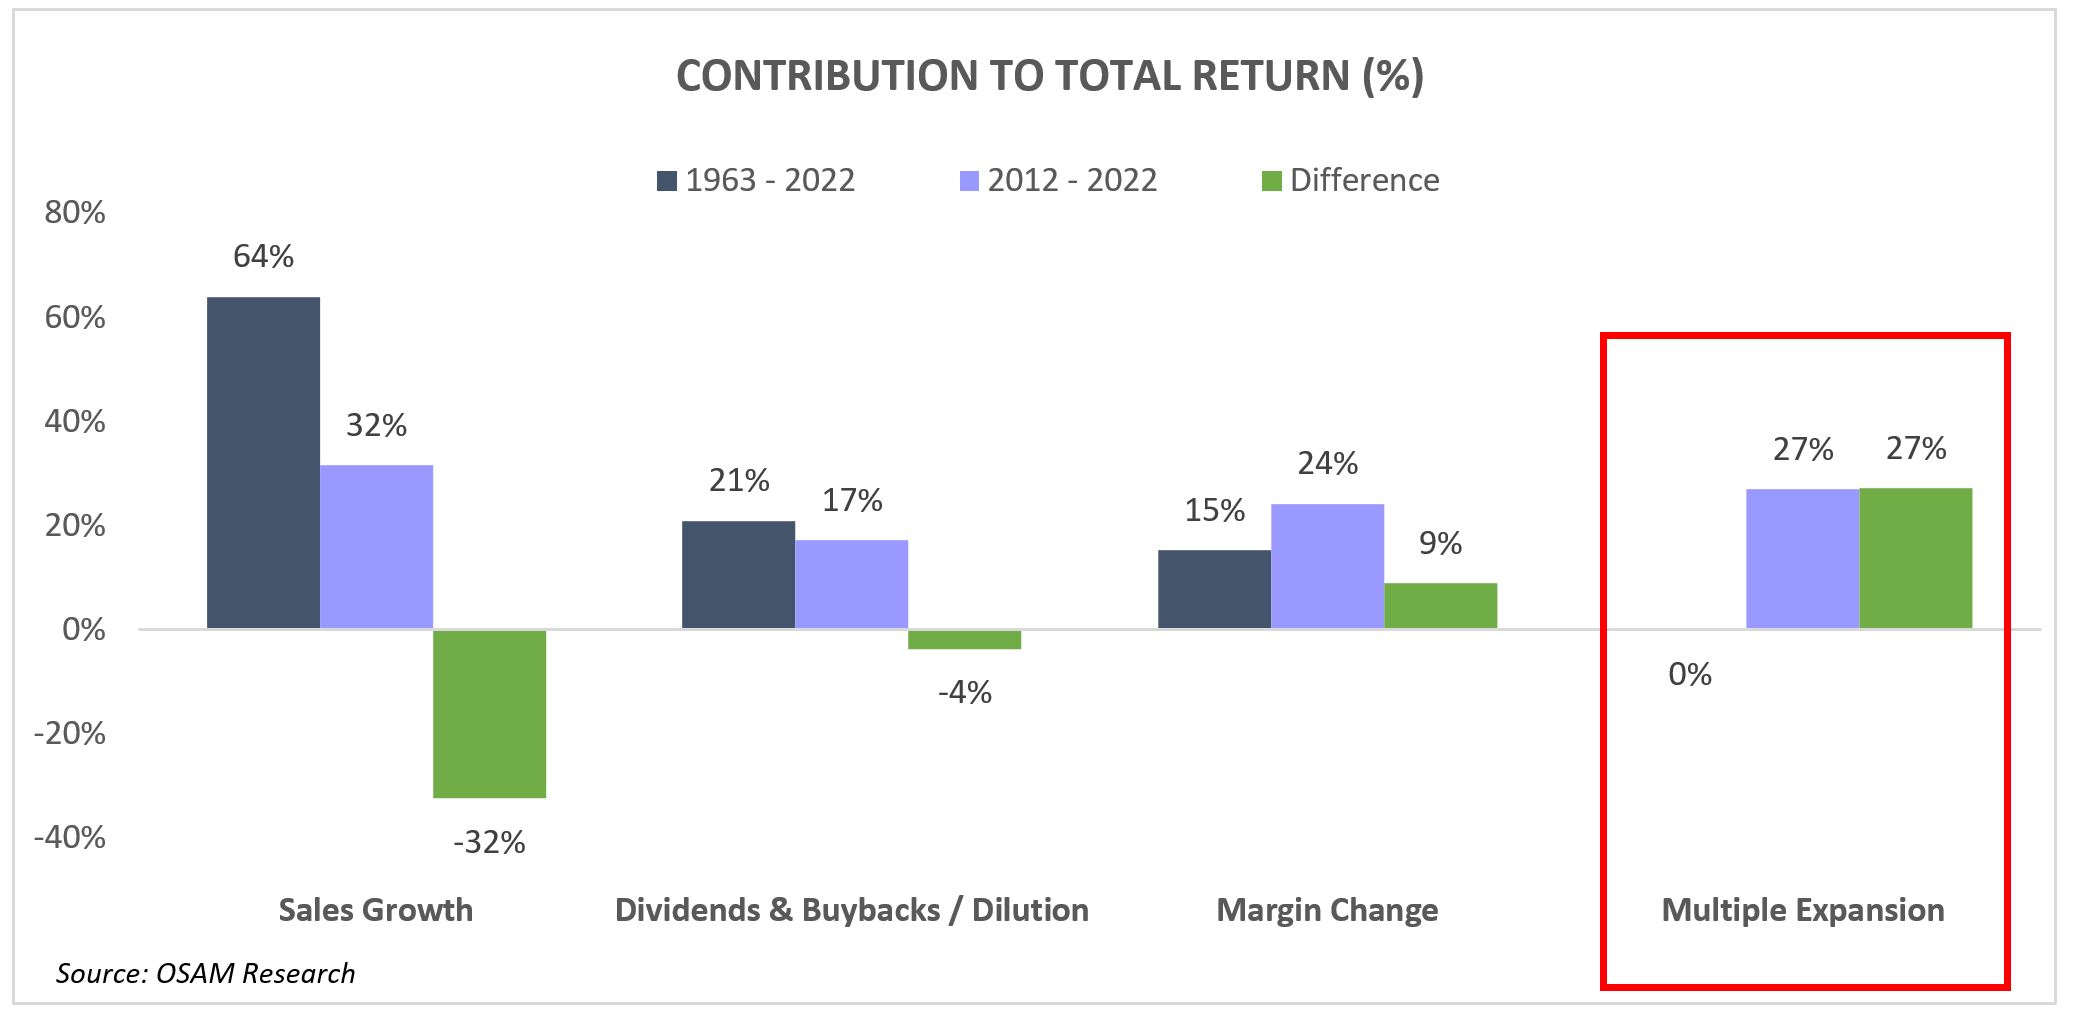
When using OSAM’s US Large Cap Stock Index and expanding the components of total return to include Profit Margin Expansion (and Buybacks alongside Dividends), the comparison is even more stark.
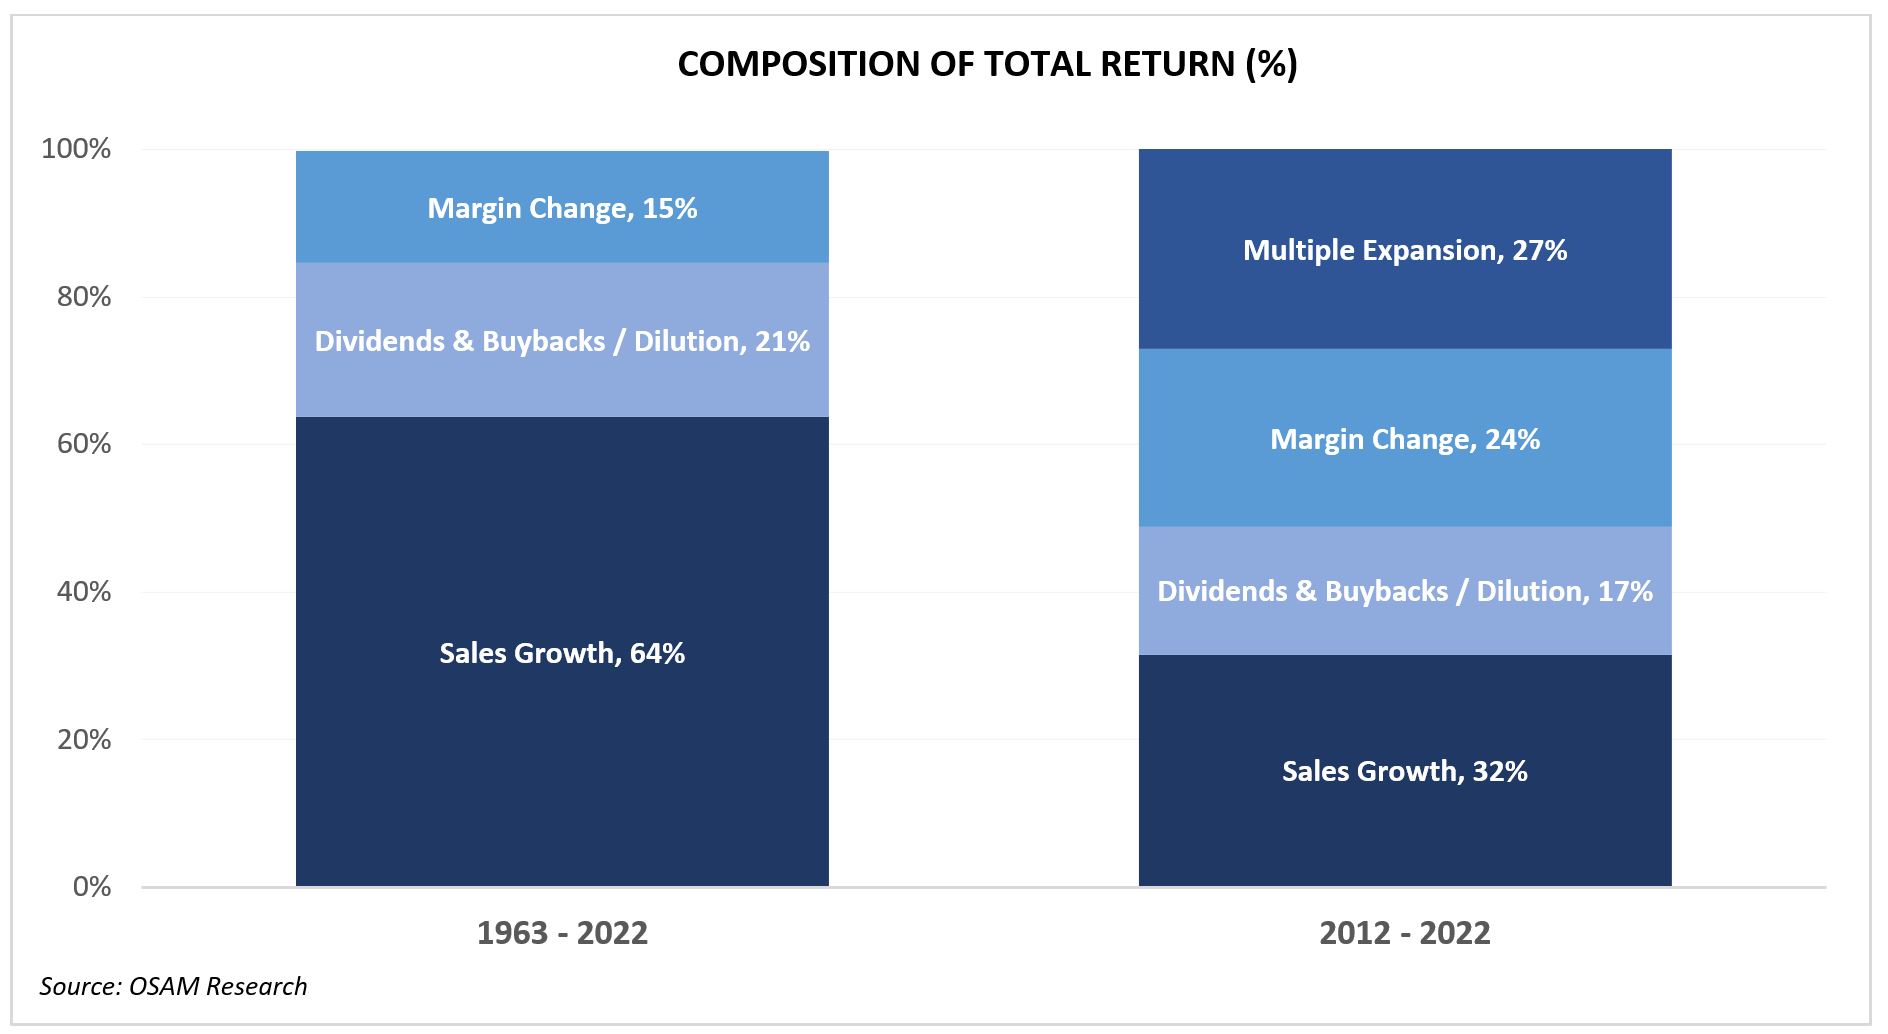
Between 1963 – July 31, 2022, Multiple Expansion had no material impact on the US Large Cap Index Total Return. Yet, since 2012, Multiple Expansion accounted for a staggering 27% of total return.
WHY DOES THIS MATTER?
Since Multiple Expansion has become a key driver of total returns, a significant portion of the equity market’s return is now derived from a “speculative” component based on expectations. As discussed, this speculative component is influenced by the powerful narratives used to entice investors.
For example, at the beginning of the pandemic, when many people were preaching that life as we knew it had irrevocably changed (e.g., no more in-person meetings, the death of business travel, etc.), shares of work-from-home stocks like Zoom traded at 464.8x next year’s earnings.3
However, investors should remember that companies primarily generating returns from multiple expansion are susceptible to wild swings because this is the least tangible source of total return. A company’s earnings don’t change on a whim, but investors’ willingness to pay higher multiples for the same stock do.
This is a great irony of the speculative feedback loop described earlier. When asset prices are rising, investors typically require less conviction or belief in an asset to purchase it. When prices are falling, however, investors meticulously study the merits of an investment and make sure they have strong conviction in its prospects.
When that happens, it’s often too late to try and increase earnings or bolster other important fundamentals that were left ignored for far too long.
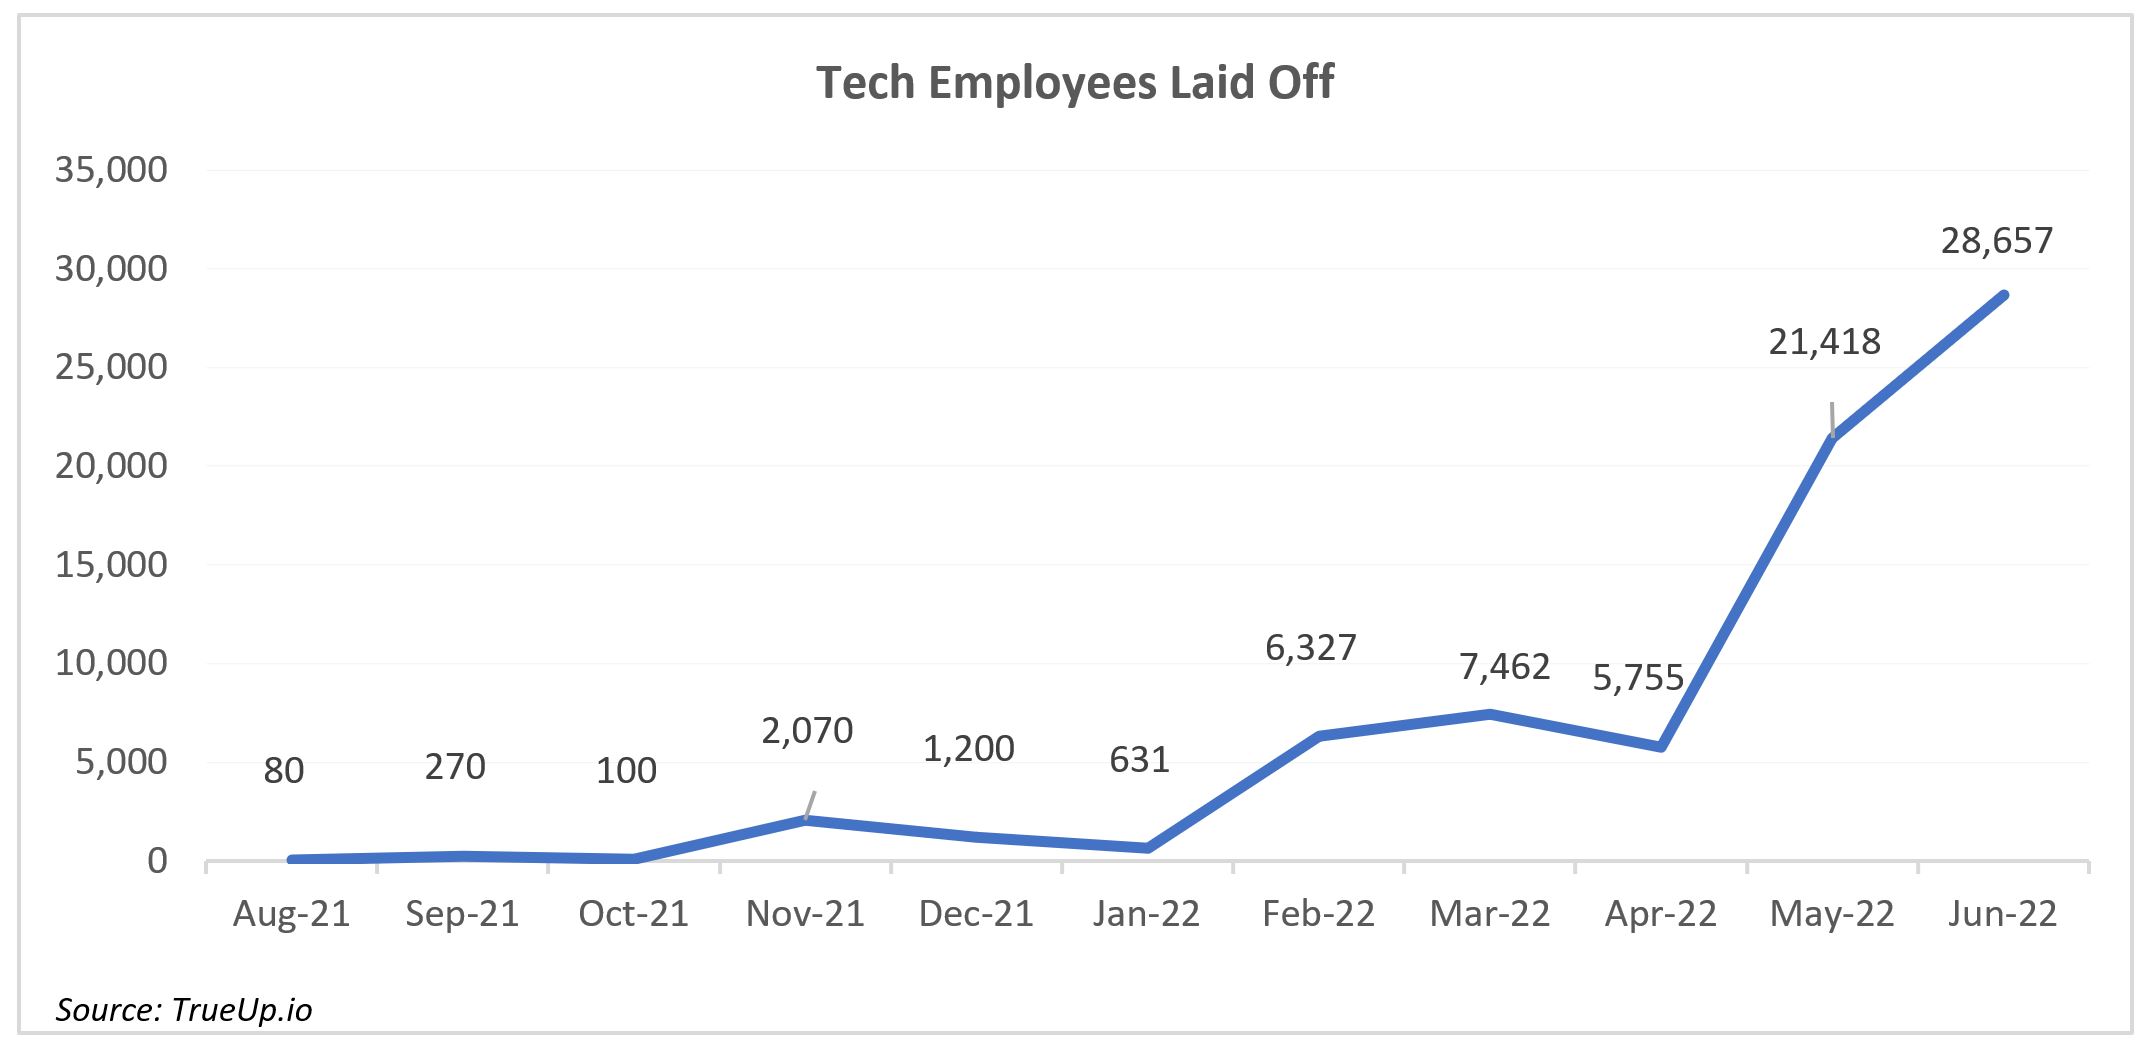
Many companies learned this lesson the hard way in 2022. The market selloff, soaring inflation, and rising interest rates has been accompanied by a substantial uptick in layoffs at the companies that thrived in a world of low interest rates, indiscriminate VC funding, and a disinterest in fundamentals. Technology and technology-adjacent companies have been particularly hard-hit:
FINAL THOUGHTS: END OF THE CHEAP MONEY DIET
Journalist Derek Thompson described the state of VC markets and unprofitable growth companies perfectly when he said:
“With markets falling and interest rates rising, start-ups and money-losing tech companies are changing the way they do business. In a recent letter to employees, Uber’s CEO, Dara Khosrowshahi, said the firm needs to “make sure our unit economics work before we go big.” That’s chief-executive speak for: We gave Derek a nice discount for a while, but the party’s over and now it costs $50 for him to get home...
It was as if Silicon Valley had made a secret pact to subsidize the lifestyles of urban Millennials. As I pointed out three years ago, if you woke up on a Casper mattress, worked out with a Peloton, Ubered to a WeWork, ordered on DoorDash for lunch, took a Lyft home, and ordered dinner through Postmates only to realize your partner had already started on a Blue Apron meal, your household had, in one day, interacted with eight unprofitable companies that collectively lost about $15 billion in one year.
These start-ups weren’t nonprofits, charities, or state-run socialist enterprises. Eventually, they had to do a capitalism and turn a profit. But for years, it made a strange kind of sense for them to not be profitable. With interest rates near zero, many investors were eager to put their money into long-shot bets. If they could get in on the ground floor of the next Amazon, it would be the one-in-a-million bet that covered every other loss...
This arrangement is tailor-made for a low-rate environment, in which investors are attracted to long-term growth more than short-term profit. As long as money was cheap and Silicon Valley told itself the next world-conquering consumer-tech firm was one funding round away, the best way for a start-up to make money from venture capitalists was to lose money acquiring a gazillion customers.”
This paradigm that Derik described so perfectly is one that’s existed for the better part of a decade. In this environment, simply “buying the dip” every time technology stocks (and the overall market) fell was a simple – and generally successful – strategy. However, those days are fading. Fast.
A decade is a lifetime in markets, and investors quickly forget what decades of empirical evidence proves: fundamentals matter.
Flashy narratives often fade, but robust fundamentals endure. Investors should heed the lessons of this selloff and ensure that they have conviction in the underlying businesses of stocks they own, and not just their share price.
Footnotes
1 Thomas Gibson, Simple Principles of Investment (1919)
2 William Fowler, Inside Life in Wall Street, or How Great Fortunes are Lost and Won (1873)
*“Global Equities” include: AUS, BEL, DEU, DNK, ESP, FIN, FRA, GBR, ITA, JPN, NLD, NOR, SWE, USA
3 June 1, 2020 (Koyfin)
Important Legal, Canvas®, Hypothetical and/or Back-tested Disclosure Information
CANVAS® is an interactive web-based investment tool developed by O’Shaughnessy Asset Management, L.L.C. (“OSAM”) that permits an investment professional (generally a registered investment advisor or a sophisticated investor) to select a desired investment strategy for the professional’s client. At all times, the investment professional, and not OSAM, is responsible for determining the initial and ongoing suitability of any investment strategy for the investment professional’s underlying client. The professional’s client shall not rely on OSAM for any such initial or subsequent review or determination. Rather, to the contrary, at all times the professional shall remain exclusively responsible for same. See more about CANVAS below and Release and Hold Harmless at the end of this Important Disclosure Information.
Reliance on Investment Professional: OSAM has relied, and shall continue to rely, on the investment professional’s knowledge and experience to understand the inherent limitations of the performance presentation, including those pertaining to back-tested hypothetical performance. All performance presentations, including hypothetical performance, are the direct result of the investment professional’s request, independent of OSAM. Depending upon the investment professional’s direction and selection, hypothetical presentations can include both OSAM and non-OSAM Models and/or strategies. The below discussion as to the material limitations of back-tested hypotheticals apply to both OSAM and non-OSAM Models and/or strategies.
Intended Recipient: CANVAS content is intended for the investment professional only not to be shared with an underlying client unless in conjunction with a meeting between the investment professional and its client in a one-on-one setting. OSAM assumes that no hypothetical performance-related content will be provided directly to the professional’s client without the accompanying consultation and explanation of the professional. The content is intended to assist the professional in evaluating the appropriate investment strategy for the professional’s client.
OSAM Models. OSAM has devised various investment models (the “Models”) for CANVAS, the objectives of each are described herein. The investment professional is not obligated to consider or utilize any of the Models. As indicated above, at all times, the investment professional, and not OSAM, is responsible for determining the initial and ongoing suitability of any Model for the investment professional’s underlying client. Model performance reflects the reinvestment of dividends and other account earnings and are presented both net of the maximum OSAM’s investment management fee for the selected strategy and gross of an OSAM investment management fee. Please Note: As indicated at Item 5 of its written disclosure Brochure, OSAM’s CANVAS management fee ranges from 0.20% to 1.15%. The average percentage management fee for all CANVAS strategies is 0.36%. The percentage OSAM management fee shall depend upon the type of strategy and the corresponding amount of assets invested in the strategy; generally, the greater the amount of assets, the lower the percentage management fee. Please Also Note: The performance also do not reflect deduction of transaction and/or custodial fees (to the extent applicable), the incurrence of which would further decrease the performance. For example, if reviewing a strategy with a ten-year return of 10.0% each year, the effect of a 0.10% transaction/custodial fee would reduce the reflected cumulative returns from 10.0% to 9.9% on a 1-year basis, 33.1% to 32.7% on a 3-year basis, 61.1% to 60.3% on a 5-year basis and 159.4% to 156.8% on a 10-year basis respectively. Please Further Note: Transaction/custodial fees will differ depending upon the account broker-dealer/custodian utilized. While some broker-dealers/custodians do not charge transaction fees for individual equity (including ETF) transactions, others do. Some custodians charge fixed fees for custody and execution services. Choice of custodian is determined by the investment professional and his/her/its client. Higher fees will adversely impact account performance.
OSAM does not maintain actual historical performance results for the Models. In order to help assist the investment professional in determining whether a Model is appropriate for the professional’s client, OSAM has provided back-tested hypothetical (i.e., not actual) performance for the Model. OSAM, with minor deviations that it does not consider to be material*, currently uses the Models (i.e., live models vs. the reflected back-tested versions thereof) to manage actual client portfolios (see Model Deviations below). The performance reflects the current Model holdings, which are subject to ongoing change.
Material Limitations: The Performance is subject to material limitations. Please see Hypothetical/Material Limitations below. During any specific point in time or time-period, the Models, as currently comprised, performed better or worse, with more or less volatility, than corresponding recognized comparative indices, benchmarks or blends thereof.
Past performance may not be indicative of future results. Therefore, it should not be assumed that future performance of any specific investment or investment strategy (including the Models), will be profitable, equal any historical index or blended index performance level(s), or prove successful. Historical index results do not reflect the deduction of transaction and custodial charges, or the deduction of an investment management fee, the incurrence of which would have the effect of decreasing indicated historical performance results. The Russell 3000 is a market capitalization-weighted index of 3000 widely held large, mid, and small cap stocks. Russell chooses the member companies for the Russell 3000 based on market size and liquidity. The MSCI All Country World Index is a market capitalization weighted index designed to provide a broad measure of equity-market performance throughout the world. The MSCI is maintained by Morgan Stanley Capital International and is comprised of stocks from 23 developed countries and 24 emerging markets. The Barclays Capital Aggregate Bond Index is a market capitalization-weighted index, meaning the securities in the index are weighted according to the market size of each bond type. Most U.S. traded investment grade bonds are represented. Municipal bonds and Treasury Inflation-Protected Securities are excluded, due to tax treatment issues. The index includes Treasury securities, Government agency bonds, Mortgage-backed bonds, corporate bonds, and a small amount of foreign bonds traded in U.S. The historical performance results for the Russell 3000, MSCI and Barclays are provided exclusively for comparison purposes only, to provide general comparative information to help assist in determining whether a Model or other type strategy (relative to the reflected indices) is appropriate for his/her investment objective and risk tolerance. Please Also Note: (1) Performance does not reflect the impact of client-incurred taxes; (2) Neither Model or the selected strategy holdings correspond directly to any such comparative index; and (3) comparative indices may be more or less volatile than the Model or selected strategy.
Hypothetical/Material Limitations-performance reflects hypothetical back-tested results that were achieved by means of the retroactive application of a back-tested portfolio and, as such, the corresponding results have inherent limitations, including: (a) the performance results do not reflect the results of actual trading using investor assets, but were achieved by means of the retroactive application of the Model or strategy (as currently comprised), aspects of which may have been designed with the benefit of hindsight; (b) back tested performance may not reflect the impact that any material market or economic factors might have had on OSAM’s (or the investment professional’s) investment decisions for the Model or the strategy; and, correspondingly; (c) had OSAM used the Model to manage actual client assets (or had the investment professional used the selected strategy to manage actual client assets) during the corresponding time periods, actual performance results could have been materially different for various reasons including variances in the investment management fee incurred, transaction dates, rebalancing dates (increases account turnover), market fluctuation, tax considerations (including tax-loss harvesting-increases account turnover), and the date on which a client engaged OSAM’s investment management services.
MORE ABOUT CANVAS®
CANVAS® is an interactive web-based investment tool developed by O’Shaughnessy Asset Management, L.L.C. (“OSAM”) that permits an investment professional (generally a registered investment advisor or a sophisticated investor) to select a desired investment strategy (the “Strategy”) for the professional’s client. At all times, the investment professional, and not OSAM, is responsible maintaining the initial and ongoing relationship with the underlying client and rendering individualized investment advice to the client. In addition, the investment professional and not OSAM, is exclusively responsible for:
· determining the initial and ongoing suitability of the Strategy for the client;
· devising or determining the specific initial and ongoing desired Strategy;
· monitoring performance of the Strategy; and,
· modifying and/or terminating the management of the client’s account using the Strategy.
Hypothetical Limitations: To the extent that the investment professional seeks for CANVAS to provide hypothetical back-tested performance, material limitations apply-See above.
Model Deviations: As indicated above, OSAM, with minor deviations that it does not consider to be material*, currently use the Models to manage actual client portfolios (i.e., the live Models). The deviations include:
· the use of proxies if and when an ETF used in the back-test was not available*. While the back-tested and live strategies both utilize the same investment themes, back-tested proxies can deviate from live models based on limitations of historical information;
· back-tested data presented utilizes a month-end rebalance while actual live model performance reflects intra-month rebalances;
· OSAM, as a discretionary manager, can update its live models as determined necessary. These changes will then be applied retroactively to back-tested models, the resulting performance of which would be different than that of the actual historical models-see Hypothetical/Material Limitations above; and,
· Financial statement information may be restated over time, which information was not reflected in the historical back-tested models. Companies will also have mergers and acquisitions or other corporate events that can retrospectively affect the names and corporate identities of organizations in the historical back-tests. Data providers providing pricing and return information may update historical data upon discovering deficiencies or omissions.
Strategy Sampling Impact: The implementation of OSAM strategies utilize a sampling of the underlying individual Strategy positions, and, as the result thereof, the underlying securities’ weighting could unintentionally deviate +/- the Strategy allocation target OSAM calculates the CANVAS fees based on the mix of strategies that are utilized at the establishment of the account. Therefore, the sampling approach can cause deviations between the Canvas strategy allocation establishment (and its corresponding fee) and the implementation of that CANVAS strategy.
ESG Portfolios/Socially Responsible Investing Limitations. To the extent applicable to the strategy chosen by the investment professional, Socially Responsible Investing involves the incorporation of Environmental, Social and Governance considerations into the investment due diligence process (“ESG). There are potential limitations associated with allocating a portion of an investment portfolio in ESG securities (i.e., securities that have a mandate to avoid, when possible, investments in such products as alcohol, tobacco, firearms, oil drilling, gambling, etc.). The number of these securities may be limited when compared to those that do not maintain such a mandate. ESG securities could underperform broad market indices. Investors must accept these limitations, including potential for underperformance. Correspondingly, the number of ESG mutual funds and exchange-traded funds are few when compared to those that do not maintain such a mandate. As with any type of investment (including any investment and/or investment strategies recommended and/or undertaken by OSAM), there can be no assurance that investment in ESG securities or funds will be profitable or prove successful.
Tax Management Function: When requested by the investment professional, OSAM will use best efforts to work within Onboarding Budgets, Annual Tax Budgets, and Tracking Error Budgets. However, market and/or specific stock price fluctuations can occur quickly and can correspondingly adversely affect our ability to manage to specified budgets. Additionally, changes to tax budgets, cash flows in and out of an account, mandatory corporate actions, and funding with securities can also impact preciseness. The investment professional must accept this risk. In addition:
· OSAM has not, and will not, verify the accuracy of any tax-related information provided;
· In the event that any such information provided is inaccurate or incomplete, the corresponding results will be inaccurate or incomplete;
· Tracking Error Budgets are relative to the Model, not the benchmark;
· OSAM is not a CPA and this is not tax advice;
· Tax laws and rates change;
· While we seek to follow the investment professional prescribed target models, ranges, timeframes, tax budgets, and seek not to create wash sales or exceed expected tax budgets, there can be no assurance that the CANVAS tool will be able to accurately do so;; and,
· For specific personalized tax-related advice, consult with a CPA or other tax professional.
Fixed Income ETF Model-The models are constructed using passive fixed income ETFs. The models attempt to target varying levels of duration and credit exposure relative to the Barclays Aggregate Index. The expense ratios of the underlying ETF’s are born by the investor and are separate and apart from CANVAS related fees.
Miscellaneous Limitations/Issues:
· Results in the Transition Portal reflect expense ratios corresponding to the specific funds indicated/provided by the investment professional. Expense ratios are provided by an unaffiliated database. Results also reflect projected future yields corresponding to such current indicated funds. Such data may not be precise;
· The risk-free rate used in the calculation of Sortino, Sharpe, and Treynor ratios is 5%, consistently applied across time;
· OSAM did not begin to offer CANVAS until April 2019. Prior to 2007, OSAM did not manage client assets; and,
· A copy of OSAM’s written disclosure Brochure, Form CRS and Privacy Notice remains available on this CANVAS website or at www.osam.com.
Release and Hold Harmless
The professional, to the fullest extent permitted under applicable law, agrees to release, defend, indemnify and hold OSAM (including its officers, directors, members, owners, employees, agents, and affiliates) harmless from any and all adverse consequences, financial or otherwise, of any type or nature arising from or attributable to the professional’s access to, and use of, CANVAS, including, but not limited to, any claims for alleged or actual client losses or damages of any kind or nature whatsoever (including without limitation, the reimbursement of reasonable attorney’s fees, costs and expenses incurred by OSAM relating to investigating or defending any such claims and/or demands), except to the extent that actual losses are the direct result of an act or omission by OSAM that constitutes willful misfeasance, bad faith or gross negligence as adjudged by a court of final jurisdiction.
*except in the unlikely event that the performance of the proxy used in lieu of the actual ETF was materially different (positive or negative)
Lastly, please be advised, without limitation, OSAM shall not be liable for Losses resulting from or in any way arising out of (i) any action of the investor or its previous advisers or other agents, (ii) force majeure or other events beyond the control of OSAM, including without limitation any failure, default or delay in performance resulting from computer or other electronic or mechanical equipment failure, unauthorized access, strikes, failure of common carrier or utility systems, severe weather or breakdown in communications not reasonably within the control of OSAM, inaccuracy or incompleteness of any third-party data, or other causes commonly known as “acts of God,” or (iii) general market conditions. Under no circumstances shall OSAM be liable for consequential, special, incidental or indirect damages, punitive damages, or lost profits or reputational harm. Additionally, the responsibility solely rests on the “master user” of CANVAS at each independent firm, and NOT OSAM, to close out any associated users who may terminate at any time.
O’Shaughnessy Asset Management, LLC (OSAM) is a wholly owned subsidiary of Franklin Resources Inc./(Franklin Templeton).

Composite Performance Summary
For the full composite performance summary of this strategy. please follow this link: http://www.osam.com


