The Power of Share Repurchases
By Patrick O’Shaughnessy
June 2014
One of the most effective stock selection strategies in the U.S. over the past several decades has been to buy stocks that are in the midst of repurchasing significant quantities of their shares—but just blindly following buybacks isn’t always the best strategy. While many companies that are repurchasing large quantities of their shares make for great investments, others are dangerous and should be avoided. There are several important factors that should be considered when evaluating a stock with impressive buybacks. These qualifications lead to a strategy with an impressive historical record of outperforming the U.S. market.
This paper outlines a very brief history of buybacks, explores the reasons (good and bad) why companies buy back stock, and explains the huge advantage available to investors incorporating buybacks into a total “shareholder yield” calculation to be used in their investment strategy, while at the same time avoiding companies that are buying back shares for the wrong reasons.
A VERY QUICK HISTORY
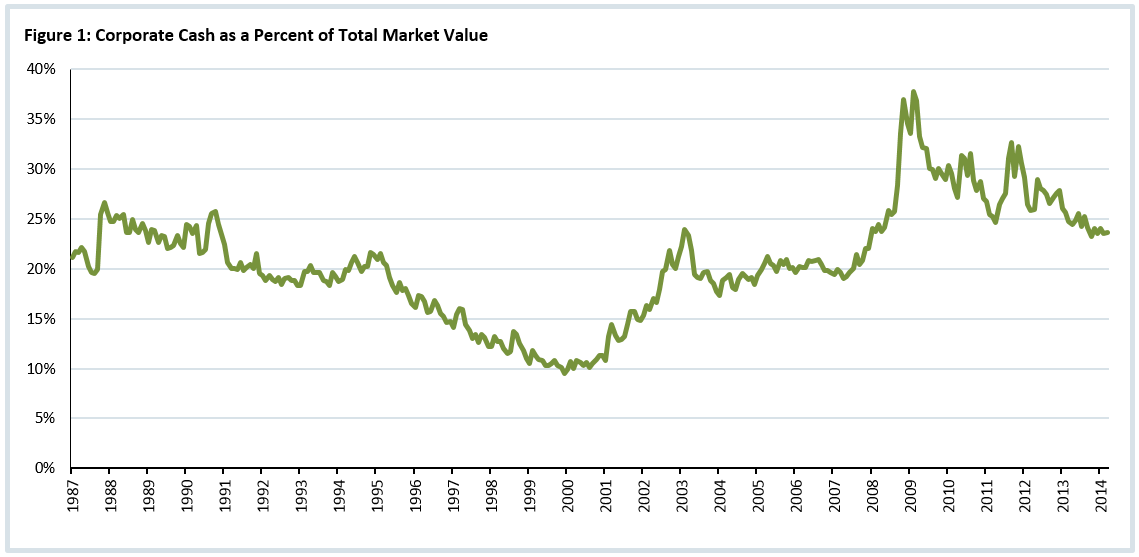
Share repurchases are an incredibly important tool for U.S. corporations. Buybacks have several large advantages over dividends, and have grown very popular as a result. Since the late 1990s, the total amount of cash used to buy back shares has exceeded cash paid out as dividends, with one brief exception during the financial crisis. U.S. companies are sitting on cash that is the equivalent of 24 percent of their combined market capitalizations as of April 2014, so buybacks figure to continue in force in the years to come.
Any study of buybacks should focus on the period after 1982. Normally, an investigation into a stock selection factor like buybacks would be best if it covered a much longer time span. However, with buybacks, a specific piece of legislation forces our attention on the period after the SEC passed the “Safe Harbor” Rule 10b-18 in 1982. This ruling protected corporations from being sued for repurchasing shares, and began an open season for share repurchases that has lasted ever since.
The best data for investigating the history of dividends and buybacks comes from the statement of cash flows, which breaks down cash used for (or coming from) dividends, share buybacks, share issuance, debt paydown, and debt issuance. Figure 2 shows the total value, in millions, of cash used by U.S. companies to make dividend payments or repurchase shares since 1987 (when the statement of cash flows was first reported).
Sometimes, companies buy back and issue shares at the same time, so we must differentiate between “gross” buybacks (dark blue line) and “net” buybacks (light blue line). “Gross” buybacks do not take into account shares issued during the same period as when shares are being repurchased, but the “net” number does. For example, if a company bought back $100 of shares and issued $20 during the same year, its gross buyback would be $100 and its net buyback would be $80.

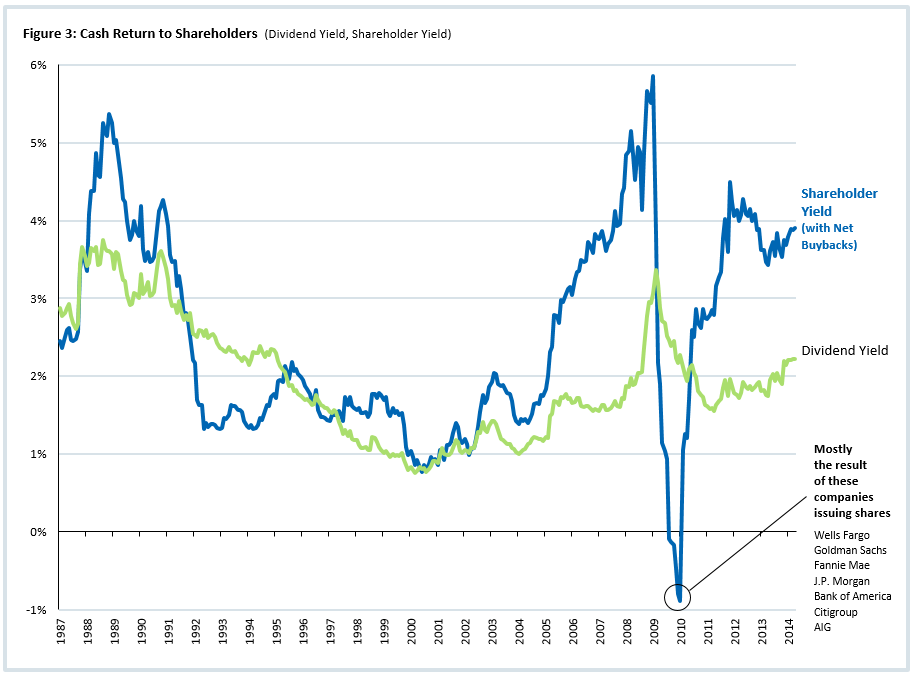
Many have complained that the market’s dividend yield—which over the very long term averages 3.8 percent1 —is very low today at just two percent.2 However, as seen in Figure 3 (see next page), when you add in the effect of net buybacks, companies in the U.S. market are still sending the cash equivalent of four percent of their market cap back to shareholders annually. This total return of cash—dividends plus net buybacks—is called “shareholder yield.” Dividend income has its virtues, but it’s taxed twice—once at the corporate level and again at the individual level. One great advantage of buybacks is that continuing shareholders don’t pay the second round of taxes.
Of note in this history of shareholder yield is the huge decline during the financial crisis, which resulted from the biggest U.S. financial companies—such as Bank of America and Citigroup—raising so much capital, but buybacks quickly rebounded. With the rise of buybacks in the U.S., shareholder yield is a more appropriate measure of yield than dividend yield alone.
WHY FIRMS REPURCHASE SHARES
There is a short list of key motivations for share repurchases:3
1. Companies like to repurchase shares when their stock is cheap, and a big buyback program often sends a message to investors that a company’s management believes its stock is trading below intrinsic value. As we shall see, this first motivation is the only one we are interested in following as investors. Companies that repurchase shares when they are expensive destroy value for shareholders.
2. Shares are sometimes bought back to offset the dilution that happens when shares are granted to employees. This isn’t a signal that the stock is cheap; rather it is just a means to maintain total shares outstanding after paying executives. One way to control for this is to focus on “net” buybacks, which we will do below.
3. Share repurchases can be used to “manage” or “boost” earnings per share (EPS)—a metric that remains extremely important to investors and to corporate executives, some of whom are paid for hitting EPS targets. By controlling the number of shares (the denominator in EPS), managers can control EPS to some degree.4
Investors using buybacks as a factor to select stocks should ensure that companies are buying back stock for the first reason, and not for the second two.
FINDING THE BEST BUYBACK PROGRAMS
Repurchasing shares when they are undervalued is one of the best ways to create value for shareholders. If a company is trading for $80, but the value of the business is really $100, then share buybacks would be the equivalent of buying dollars for 80 cents each. And nobody understands a company’s intrinsic value better than the managers of that company (well, at least one would hope!). Companies engaged in this proper sort of share repurchases make for great investments—provided their motivations are not tainted. Three factors can be used to weed out unattractive share repurchasers:
1. Investors should focus on “net” buyback yield, which takes share issuance into account alongside buybacks, rather than “gross” yield, which does not.
2. Investors should avoid companies that have significant buyback programs but trade at expensive valuation multiples.
3. Investors should avoid the “EPS management” problem by insisting on strong quality of earnings alongside big buyback programs.
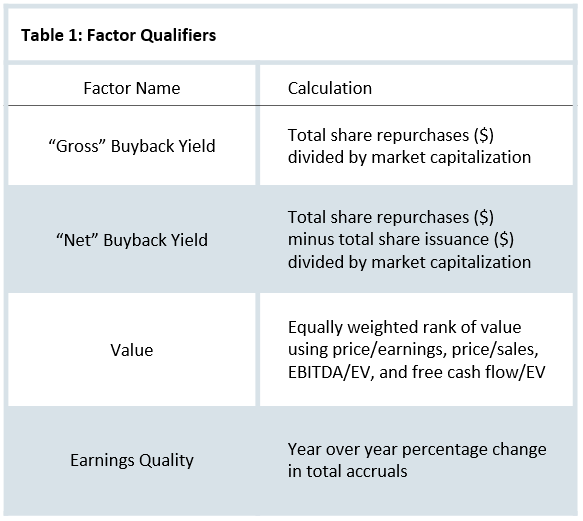
Let’s look at how each of these qualifiers improves the signal from buybacks. Table 1 above details the calculation used for each factor in this analysis.
First up is a comparison of the two different calculations for “buyback yield.” The period tested is 1987–2014 because the statement of cash flows is required to calculate gross and net buyback yield. Table 2 breaks the universe of all U.S. stocks into deciles (10 percent buckets) based on the two measures of buybacks and shows the excess return earned by each decile versus the market since 1987.5 Deciles are rebalanced on a rolling annual basis.
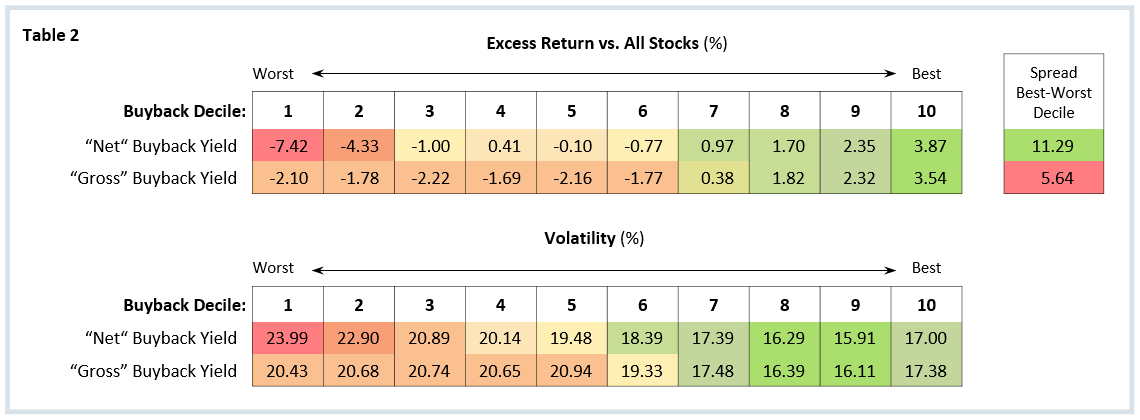
In each case, companies that have made the largest share repurchases over the prior year have gone on to significantly outperform the market in the following year, and have done so with fairly low volatility. But by focusing on the “worst” decile of these factors, you can see that the “net” version is far more useful. Often, a stock selection factor like buybacks is as useful for the stocks that it helps investors avoid as for the stocks that it leads them to buy. One way of measuring the “strength” of a factor is to look at the return spread between the best decile and the worst decile—the wider the spread, the more useful the factor. Clearly, the “net” versions of the buyback factor that take share issuance into account provide a much stronger signal. Companies issuing large amounts of equity have historically underperformed the market by a wide margin. By focusing on net buybacks instead of gross, investors can protect against firms that are buying back shares just to offset shares issued to employees or issued for other reasons.
VALUE IS KEY
The buyback deciles above were calculated in the “All Stock”6 universe to show the broad applicability of the factor, but the majority of large buyback programs are conducted by large, established firms. The large cap space is also supposedly the most “efficient” and difficult to outperform, so now let’s narrow the analysis to just large stocks, to show that two additional refinements significantly improve the raw buyback signal even among large cap stocks.
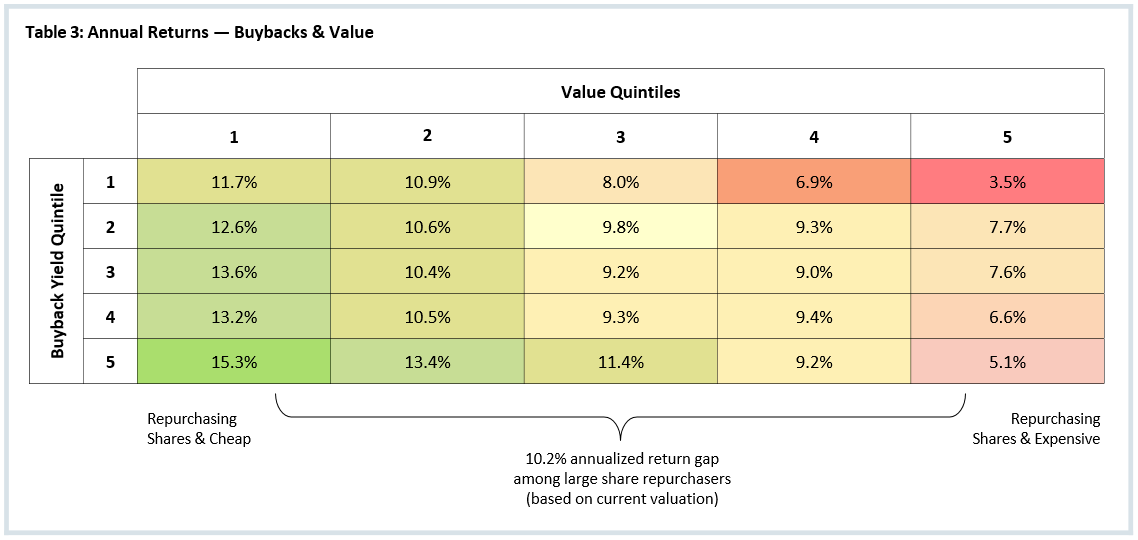
We’ve controlled for the first pitfall of buybacks (repurchases to offset share issuance). The second pitfall is buying companies with large repurchase programs that are buying back shares at exactly the wrong time: when their stock price is very expensive. Table 3 below breaks all large stocks into 25 groups according to two factors: their net buybacks, and their valuations (value calculated using the definition in Table 1). It shows each group’s historical annualized return.
Stocks in the upper right—which do very poorly—are both expensive and issuing shares; this is a brutal combination. Stocks in the lower left, with a return of 15.3 percent, are buying back lots of shares, but are doing so when the stock is also cheap; this has been a powerful combination historically. Finally, stocks in the lower right are also buying back lots of shares, but are trading at expensive valuation multiples. This final group has a return of just 5.1 percent, which means that there is a 10 percent difference in historical annual return between the top share repurchasers that are cheap and the top share repurchasers that are expensive (15.3 percent versus 5.1 percent). This evidence confirms that value is a crucial component to any strategy that favors large buybacks. Investors should avoid buying stocks trading at very expensive multiples, no matter how significant their buyback programs.
INSIST ON QUALITY EARNINGS
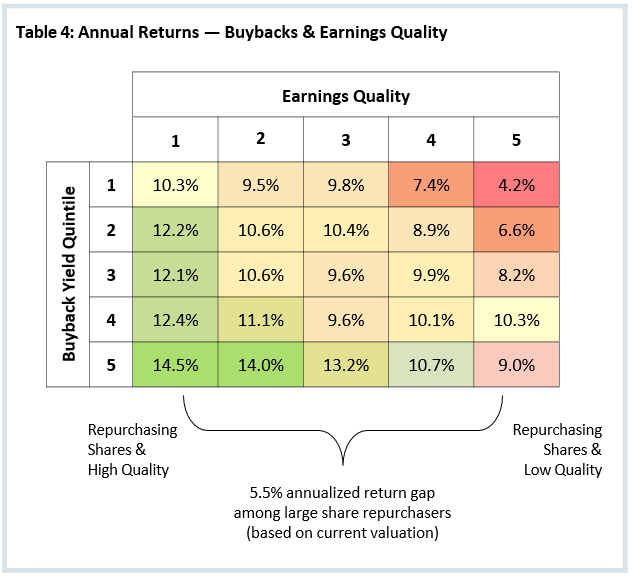
After controlling for dilution and avoiding companies that are buying back shares at expensive prices, the final key qualification is to avoid companies that seem to be manipulating or smoothing their earnings. Table 4 below shows the same 25 groups—again among large cap stocks—but instead of combining buybacks with value, it combines buybacks with earnings quality. A similar story emerges. The bottom row illustrates that strong buybacks and strong earnings quality produce a much better annual result (14.5 percent) than strong buybacks and poor earnings quality (9.0 percent).
STOCK EXAMPLE: SEAGATE TECHNOLOGY
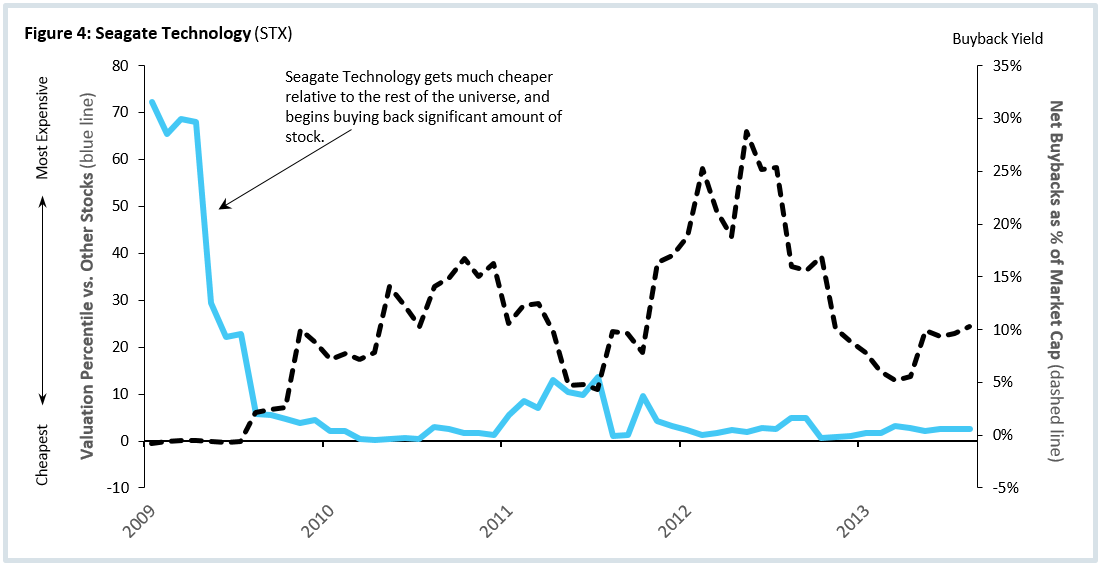
One good historical example is Seagate Technology. Figure 4 below shows a time series of Seagate’s valuation percentile versus the rest of the market (blue line) and its net buyback yield (dashed line), which is calculated as the net dollar amount of shares repurchased over the last year divided by market capitalization.
Seagate’s stock went from one of the more expensive in the market to one of the cheapest very quickly, and they’ve been aggressively repurchasing shares ever since; at one point, the dollar amount repurchased over the prior year was the equivalent of nearly 30 percent of its total market cap!
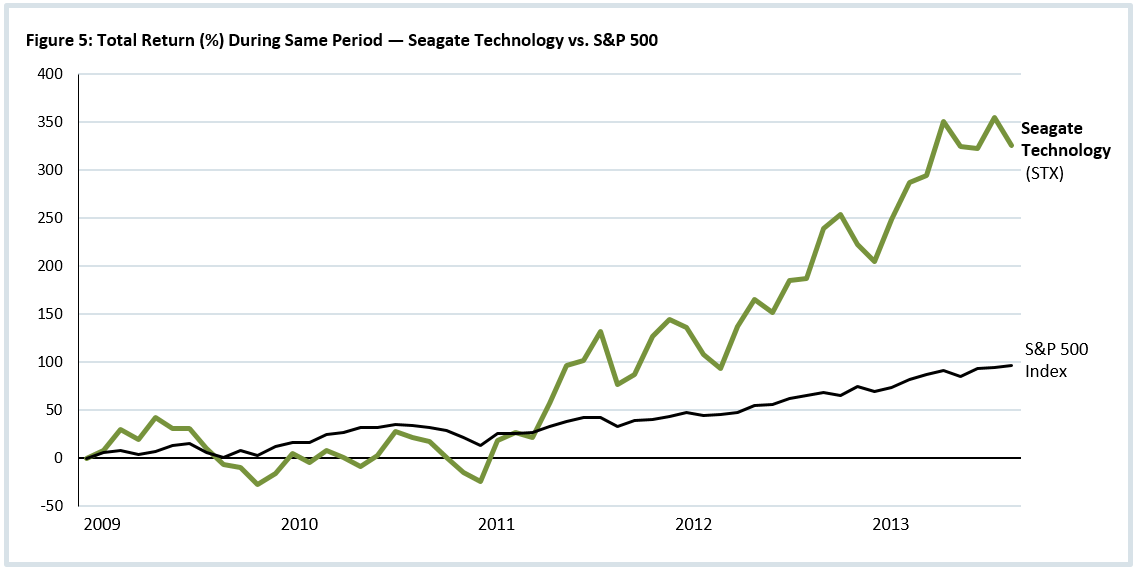
During the same period (see Figure 5, below), Seagate has significantly outperformed the S&P 500 with a total return of 326 percent (versus 96 percent for the market over the same period).
A COMPLETE APPROACH TO YIELD
As Warren Buffett has said, “By making repurchases when a company’s market value is well below its business value, management clearly demonstrates that it is given to actions that enhance the wealth of shareholders, rather than to actions that expand management’s domain but that do nothing for (or even harm) shareholders.” As Buffett hints at here, share repurchase programs are also a proxy for management discipline. Often, managers flushed with cash elect to use that cash to acquire other firms or invest in new ventures that are speculative or unlikely to earn an acceptable rate of return (that is, a return above some hurdle rate—be it a fixed percentage, or the opportunity cost of capital). These sorts of reckless investments often destroy shareholder value. For example, a variety of studies have shown that between 70–90 percent of mergers fail to create value for shareholders.7 On the other hand, if managers recognize value in their own share price, then foregoing misguided investments and opting instead for large share repurchases can create huge value for shareholders.
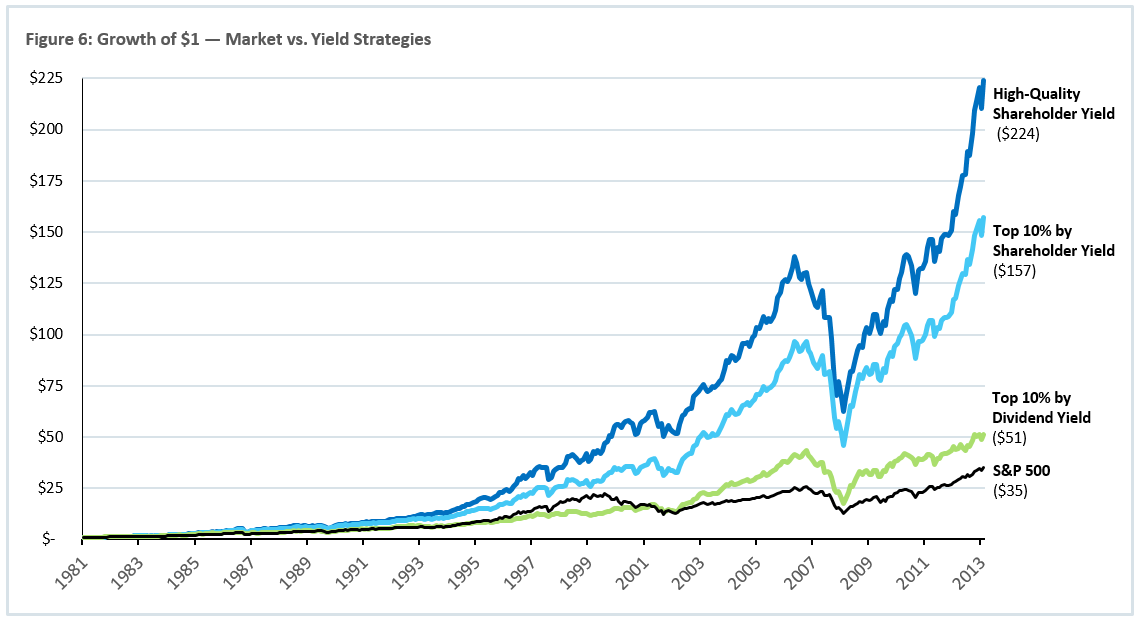
To bring all of these concepts together, consider the growth of one dollar invested in 19828 (see Figure 6, below) in four different large cap strategies:
1. S&P 500
2. Top 10 percent of large stocks by dividend yield (this strategy, and the following two, are run with a rolling annual rebalance)
3. Top 10 percent of large stocks by shareholder yield (dividends + buybacks)
4. Top large stocks by shareholder yield after eliminating the half of the stock universe with the worst valuation and poorest quality
Each incremental refinement to investing in the U.S. large cap stocks has led to significant improvement in returns. After controlling for nefarious or misguided motivations, a strategy based on both dividends and buybacks has delivered outsized returns since 1982. Further qualifying the strategy by insisting on attractive valuations and high-quality earnings creates a strategy that has been formidable in what arguably should be the most efficient area of the global stock market.
Footnotes:
1 Average yield for S&P 500 (1926–2014), data from Global Financial Data.
2 2 percent is the approximate total yield on the U.S. market, determined by summing all dividend payments made by U.S. companies with a market cap greater than $200 million divided by the total market cap of those same companies. The dividend yield on the S&P 500 is a similar 2.05 percent.
3 A fourth reason would be to affect the company’s operating leverage.
4 EPS will increase only if the company’s price-to-earnings ratio is below a breakeven level determined by the following formula: 1 ÷ (interest rate × (1-corporate tax rate)) where the interest rate is either the return being earned on the cash used to buy back shares, or the rate paid on the debt capital raised to fund the buyback program. This is less impactful in today’s environment when cash earns next to nothing and debt is so cheap (think of Apple’s large debt issuance used to buy back stock).
5 Deciles are rebalanced on a rolling annual basis to avoid any seasonality issues.
6 All companies with an inflation adjusted market cap greater than $200 million.
7 A study by KPMG International (1999) found 83 percent fail to create shareholder value, a study by Bain & Company (2004) found 70 percent fail, and a study by the Hay Group at the Sorbonne (2007) found 90 percent of mergers in Europe failed to add value.
8 To bring the test back to 1982, prior to the statement of cash flows, we calculate buyback yield as the year over year percentage change in shares outstanding, which is a “net” buyback yield.
General Legal Disclosure/Disclaimer and Backtested Results
The material contained herein is intended as a general market commentary. Opinions expressed herein are solely those of O’Shaughnessy Asset Management, LLC and may differ from those of your broker or investment firm.
Please remember that past performance is no guarantee of future results. Different types of investments involve varying degrees of risk, and there can be no assurance that the future performance of any specific investment, investment strategy, or product made reference to directly or indirectly in this presentation, will be profitable, equal any corresponding indicated historical performance level(s), or be suitable for any portfolio. Gross of fee performance computations are reflected prior to OSAM’s investment advisory fee (as described in OSAM’s written disclosure statement), the application of which will have the effect of decreasing the composite performance results (for example: an advisory fee of 1% compounded over a 10-year period would reduce a 10% return to an 8.9% annual return). Due to various factors, including changing market conditions, the content may no longer be reflective of current opinions or positions. Moreover, you should not assume that any discussion or information contained in this presentation serves as the receipt of, or as a substitute for, individualized investment advice from OSAM.
Historical performance results for investment indices and/or categories have been provided for general comparison purposes only, and generally do not reflect the deduction of transaction and/or custodial charges, the deduction of an investment management fee, nor the impact of taxes, the incurrence of which would have the effect of decreasing historical performance results. It should not be assumed that any account holdings would correspond directly to any comparative indices. Account information has been compiled solely by OSAM, has not been independently verified, and does not reflect the impact of taxes on non-qualified accounts. In preparing this presentation, OSAM has relied upon information provided by the account custodian and/or other third party service providers. OSAM is a Registered Investment Adviser with the SEC and a copy of our current written disclosure statement discussing our advisory services and fees remains available for your review upon request.
Hypothetical performance results shown on the preceding pages are backtested and do not represent the performance of any account managed by OSAM, but were achieved by means of the retroactive application of each of the previously referenced models, certain aspects of which may have been designed with the benefit of hindsight.
The hypothetical backtested performance does not represent the results of actual trading using client assets nor decision-making during the period and does not and is not intended to indicate the past performance or future performance of any account or investment strategy managed by OSAM. If actual accounts had been managed throughout the period, ongoing research might have resulted in changes to the strategy which might have altered returns. The performance of any account or investment strategy managed by OSAM will differ from the hypothetical backtested performance results for each factor shown herein for a number of reasons, including without limitation the following:
- Although OSAM may consider from time to time one or more of the factors noted herein in managing any account, it may not consider all or any of such factors. OSAM may (and will) from time to time consider factors in addition to those noted herein in managing any account.
- OSAM may rebalance an account more frequently or less frequently than annually and at times other than presented herein.
- OSAM may from time to time manage an account by using non-quantitative, subjective investment management methodologies in conjunction with the application of factors.
- The hypothetical backtested performance results assume full investment, whereas an account managed by OSAM may have a positive cash position upon rebalance. Had the hypothetical backtested performance results included a positive cash position, the results would have been different and generally would have been lower.
- The hypothetical backtested performance results for each factor do not reflect any transaction costs of buying and selling securities, investment management fees (including without limitation management fees and performance fees), custody and other costs, or taxes – all of which would be incurred by an investor in any account managed by OSAM. If such costs and fees were reflected, the hypothetical backtested performance results would be lower.
- The hypothetical performance does not reflect the reinvestment of dividends and distributions therefrom, interest, capital gains and withholding taxes.
- Accounts managed by OSAM are subject to additions and redemptions of assets under management, which may positively or negatively affect performance depending generally upon the timing of such events in relation to the market’s direction.
- Simulated returns may be dependent on the market and economic conditions that existed during the period. Future market or economic conditions can adversely affect the returns.
The dividend yield is a gross indicated yield. There is no guarantee that the rate of dividend payment will continue and the income derived is subject to taxes and expenses which will impact the actual yield experience of each investor.


