The Inefficient Canadian Market
By OSAM Research Team
April 2016
Despite robust performance, the Canadian market gets little consideration as a dedicated piece of an overall asset allocation outside of the country. Canadian equities have a long history, dating back to 1861, and today it ranks as the world’s fourth largest stock market by market capitalization. Over the period from 1900 to 2014, adjusted for inflation, Canadian equities have returned 5.8 percent annualized, which compares favorably to the U.K’s return of 5.3 percent and slightly lags the U.S. return of 6.5 percent.*
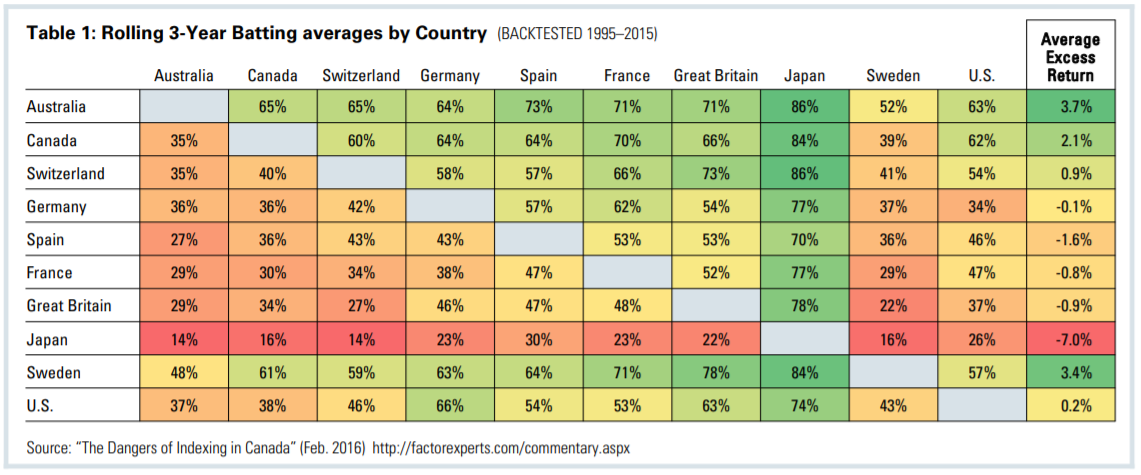
Over the most recent 20-year period, the Canadian stock market has been one of the best performers in terms of both absolute return and consistency (see Table 1 below). For example, Canada even outpaces the U.S.—widely considered to be the most dynamic equity market in the world—with a winning percentage of 62 percent (135 out of 217 rolling three-year periods). Canada ranks third with an average excess return of 2.1 percent over all rolling time frames, trailing only Australia and Sweden.
At O’Shaughnessy Asset Management (OSAM), we believe Canadian equities present investors with an overlooked opportunity for consistent long-term return. In this paper, we will examine the structure of the Canadian market and highlight why we consider it to be less efficient than the U.S. with the implication that inefficiency results in the potential to outperform. As well, based on our research spanning nearly three decades, we will highlight why the Canadian equity space provides equivalent or greater alpha potential—including greater safety and less cost—relative to other less efficient markets.
Market Inefficiency
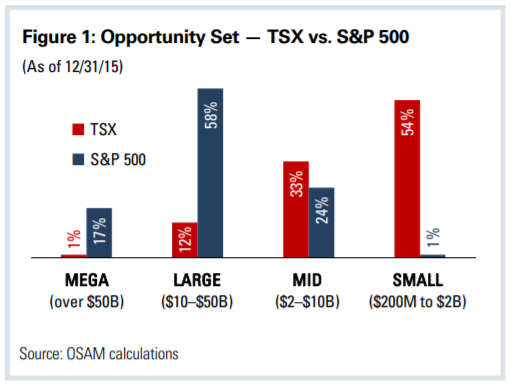
The benchmark indices for the U.S. and Canada, the S&P 500, and the S&P/TSX cover the cap spectrum within their respective markets. However, the Canadian market is heavily skewed towards small and mid cap stocks. As of year end 2015, 33 percent of companies on the S&P/TSX are classified as mid cap while 54 percent are in the small cap space—compared to only 24 percent and one percent in the small and mid cap buckets within the U.S. market (see Figure 1).
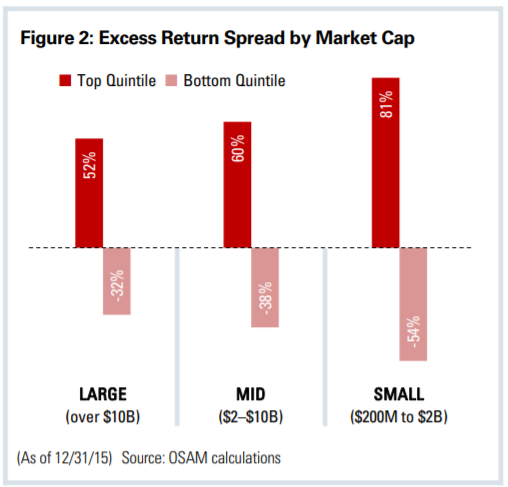
This is important because small and mid cap stocks exhibit greater dispersion between the highest and lowest performers. To illustrate this point, we perform a simple test assuming we know in advance the return of each stock over the next 12 months and rank the return by quintile within each market cap bucket (see Figure 2). The universe of small cap stocks within Canada has the greatest return spread between the top and bottom quintile (135 percent). As we move up the capitalization range, the spread declines to 98 percent for mid cap and 84 percent for large cap stocks. The wider dispersion in returns for small and mid cap companies suggests there are greater inefficiencies as you move down the capitalization spectrum. Aligning portfolio characteristics with consistent winners while avoiding traits of consistent underperformers provides investors with the potential to outperform over the long run.
Stability & Cost Matter
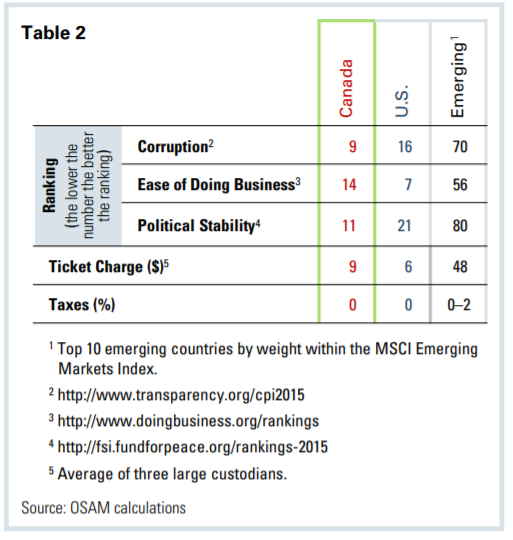
While an inefficiently-priced market provides alpha opportunity for investors, it is not a cure all for achieving excess returns. Common concerns about investing outside of the U.S. are related to stability and cost. When comparing Canada against the U.S. and emerging markets, we observe a favorable climate for investing in equities according to rankings by three non-governmental organizations (see Table 2). Based on corruption, ease of doing business, and political stability, Canada ranks in the best 15 out of more than 150 countries. Of equal importance is the low ticket charge from custodians associated with trading a Canadian stock at $9 relative to the emerging space at $48. This cost differential makes smaller account sizes more viable in Canada, since fees can significantly erode return. Finally, Canada offers investors more favorable tax treatment than emerging markets. Depending on the country, emerging market countries levy as much as a two percent local or stamp duty tax on all transactions.
Factor Alpha Efficacy
A common way for quantitative researchers to evaluate the efficacy of a factor is to compare the return spread between the highest- and lowest-ranking decile. To understand where Canada falls on the efficiency spectrum we compare it to the U.S.—widely considered the most difficult market to outperform—and to a less efficient region such as emerging markets.
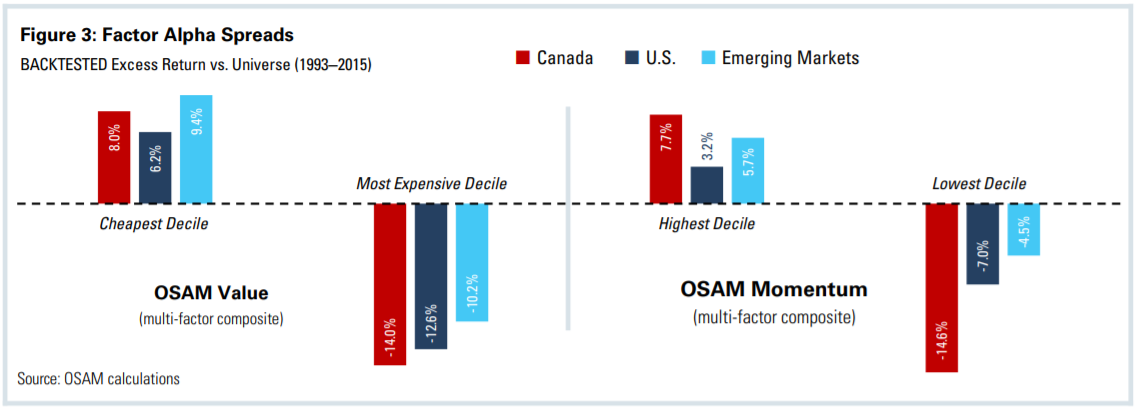
Over the period spanning from 1993 to 2015, the spread between the cheapest and most expensive decile by OSAM Value in Canada is 22 percent—beating the 19 percent spread for the U.S. The efficacy of Value in Canada also exceeds emerging markets by approximately 2.4 percent. For OSAM Momentum, we see even more impressive results in Canada. The spread between the highest- and lowest-scoring Momentum decile in Canada is approximately 22.3 percent—exceeding the spread offered in both the U.S. and emerging markets by more than 12 percent. The wide dispersion suggests there are significant benefits derived from aligning portfolio characteristics with the proven themes of valuation and momentum. In particular, within Canada these themes have exhibited outsized efficacy relative to the U.S. and even emerging markets.
CONCLUSION
Small and mid cap stocks account for approximately 87 percent of the investable opportunity set within Canada. As well, we have established greater dispersion of returns between the top and bottom performers as you move down the capitalization spectrum, indicating greater inefficiencies for active managers to exploit. We believe the business climate in Canada is among the best in the world—it achieves a high ranking based on corruption, ease of doing business, and stability, while also keeping costs low for cheap investor access. Finally, the themes of value and momentum investing show particular efficacy in Canada, exhibiting spreads in excess of the U.S. and emerging markets.
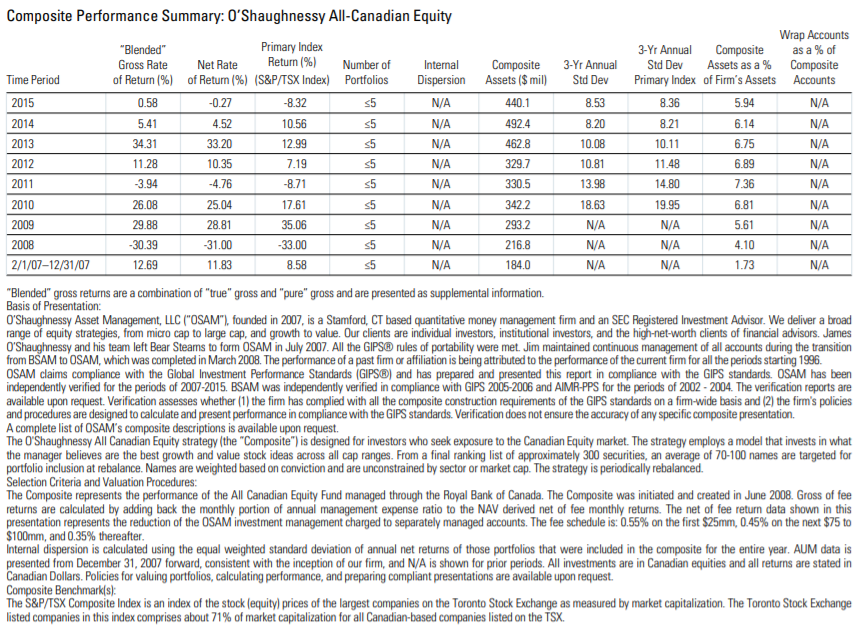
OSAM has managed Canadian equity strategies since 1997, utilizing the themes of value and momentum as the primary stock selection criteria. O’Shaughnessy All-Canadian equity has beaten the S&P/TSX in 100 percent of all rolling three-year periods since inception and has generated 5.5 percent annualized excess return** during that period.
Footnotes:
* Elroy Dimson, Paul Marsh, Mike Staunton; “Credit Suisse Global Investment Returns Yearbook 2015” (Feb. 2015) http://bit.ly/16TVzOJ
** Gross of fees, CAD (as of 2/29/16). Inception date: February 1, 2007.
General Legal Disclosures & Hypothetical and/or Backtested Results Disclaimer
The material contained herein is intended as a general market commentary. Opinions expressed herein are solely those of O’Shaughnessy Asset Management, LLC and may differ from those of your broker or investment firm.
It should not be assumed that your account holdings correspond directly to any comparative indices. Individual accounts may experience greater dispersion than the composite level dispersion (which is an asset weighted standard deviation of the accounts in the composite for the full measurement period). This is due a variety of factors, including but not limited to, the fresh start investment approach that OSAM employs and the fact that each account has its own customized re-balance frequency. Over time, dispersion should stabilize and track more closely to the composite level dispersion. Gross of fee performance computations are reflected prior to OSAM’s investment advisory fee (as described in OSAM’s written disclosure statement), the application of which will have the effect of decreasing the composite performance results (for example: an advisory fee of 1% compounded over a 10-year period would reduce a 10% return to an 8.9% annual return). Portfolios are managed to a target weight of 3% cash. Account information has been compiled by OSAM derived from information provided by the portfolio account systems maintained by the account custodian(s), and has not been independently verified. In calculating historical asset class performance, OSAM has relied upon information provided by the account custodian or other sources which OSAM believes to be reliable. OSAM maintains information supporting the performance results in accordance with regulatory requirements. Please remember that different types of investments involve varying degrees of risk, that past performance is no guarantee of future results, and there can be no assurance that any specific investment or investment strategy (including the investments purchased and/or investment strategies devised and/or implemented by OSAM) will be either suitable or profitable for a prospective client’s portfolio. OSAM is a registered investment adviser with the SEC and a copy of our current written disclosure statement discussing our advisory services and fees continues to remain available for your review upon request.
Hypothetical performance results shown on the preceding pages are backtested and do not represent the performance of any account managed by OSAM, but were achieved by means of the retroactive application of each of the previously referenced models, certain aspects of which may have been designed with the benefit of hindsight.
The hypothetical backtested performance does not represent the results of actual trading using client assets nor decision-making during the period and does not and is not intended to indicate the past performance or future performance of any account or investment strategy managed by OSAM. If actual accounts had been managed throughout the period, ongoing research might have resulted in changes to the strategy which might have altered returns. The performance of any account or investment strategy managed by OSAM will differ from the hypothetical backtested performance results for each factor shown herein for a number of reasons, including without limitation the following:
- Although OSAM may consider from time to time one or more of the factors noted herein in managing any account, it may not consider all or any of such factors. OSAM may (and will) from time to time consider factors in addition to those noted herein in managing any account.
- OSAM may rebalance an account more frequently or less frequently than annually and at times other than presented herein.
- OSAM may from time to time manage an account by using non-quantitative, subjective investment management methodologies in conjunction with the application of factors.
- The hypothetical backtested performance results assume full investment, whereas an account managed by OSAM may have a positive cash position upon rebalance. Had the hypothetical backtested performance results included a positive cash position, the results would have been different and generally would have been lower.
- The hypothetical backtested performance results for each factor do not reflect any transaction costs of buying and selling securities, investment management fees (including without limitation management fees and performance fees), custody and other costs, or taxes – all of which would be incurred by an investor in any account managed by OSAM. If such costs and fees were reflected, the hypothetical backtested performance results would be lower.
- The hypothetical performance does not reflect the reinvestment of dividends and distributions therefrom, interest, capital gains and withholding taxes.
- Accounts managed by OSAM are subject to additions and redemptions of assets under management, which may positively or negatively affect performance depending generally upon the timing of such events in relation to the market’s direction.
- Simulated returns may be dependent on the market and economic conditions that existed during the period. Future market or economic conditions can adversely affect the returns.