The Economic Cycle: A Factor Investor’s Perspective
By Ehren Stanhope
May 2016
KEY FINDINGS:
- The persistent outperformance of certain investment factors across the economic cycle argues against passive equity allocations.
- Investment factors are not rewarded linearly across the cycle.
- Factor spreads tend to expand in and around recessions, suggesting there is greater potential for disciplined active managers to deliver outperformance during those periods.
Debates abound on the relative importance of the economic cycle to investment success. Peter Lynch famously said, “If you spend more than 13 minutes analyzing economic and market forecasts, you’ve wasted 10 minutes.” On the flip side, macro investment houses have constructed intricate frameworks to understand the “economic machine.” The challenge with economic data is that it is notoriously prone to revisions, significant lags, and adjustments in how it is measured through time—none of which are suitable for timely and reliable investment signals.
As factor investors, we believe that certain fundamental characteristics, as distinct from economic variables, drive stock returns. Our job as researchers is to distill the hundreds of investment factors into cohesive themes that can serve as foundational building blocks for equity strategies. Among the litmus tests for those themes is persistence. The purpose of this piece is to identify investment themes that deliver persistent outperformance in multiple different economic environments. By doing so, we lessen the burden of market timing—an often subjective and error-prone exercise.
Parsing the Cycle
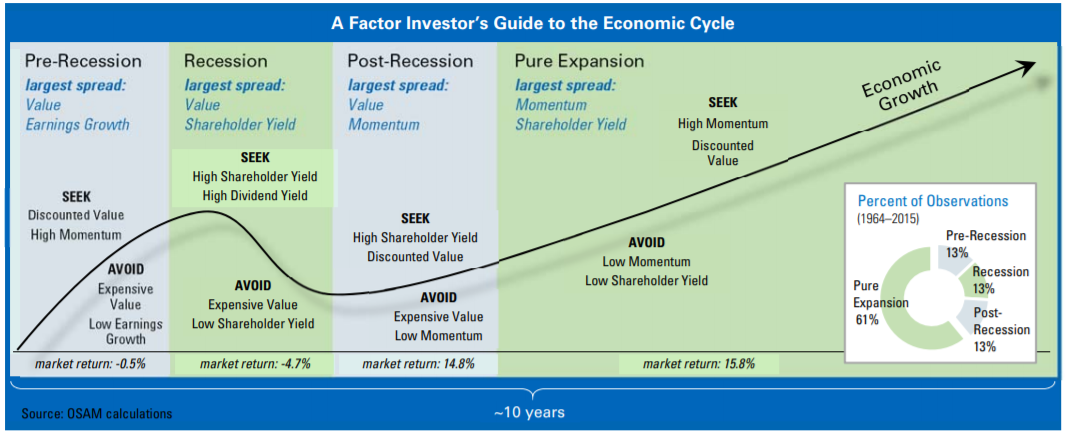
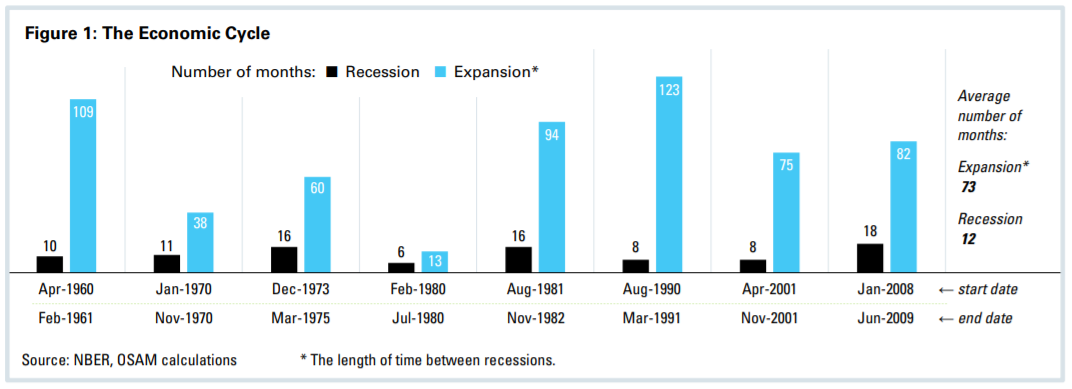
The National Bureau of Economic Research (NBER) has designated seven recessionary periods from 1964 through 2015. The average length of recession was a relatively short 12 months. The average length in between recessions—an “expansion”—was more than six times as long (73 months). In fact, out of the 624 months in our study from 1964–2015, expansions represented the vast majority of observations at 541 (87 percent), versus recessions at 83 (13 percent). Because recessions are notoriously challenging to predict, and only truly viewable in hindsight, we further distinguish these four phases of the economic cycle in our analysis:
Recession: NBER defines this period as “a significant decline in economic activity spread across the economy, lasting more than a few months, normally visible in real GDP, real income, employment, industrial production, and wholesale-retail sales.”1 For the purposes of this study, we use the official NBER recession beginning and ending dates.
Pre-Recession: The 12 months prior to a NBER designated recession. This period would be analogous to the late stage of an economic expansion, just before economic growth trails off and turns negative.
Post-Recession: The 12 months after a NBER designated recession. These periods represent the early stages of recovery when economic growth bottoms out and begins to turn positive.
Pure Expansion: Anything that is not included in the Pre-Recession, Recession, or Post-Recession periods, we call Pure Expansion. This represents periods in which economic growth is robust.
Our goal is to identify which factor themes are most effective in the different regimes and draw inference for portfolio allocations. Before diving into the four regimes, we discuss overall factor performance from 1964–2015 as a baseline for the analysis.
Level-Setting: Overall Factor Performance
The Research Team at OSAM has distilled the myriad potential investment factors into six distinct themes that we believe deliver the best absolute, risk-adjusted, and consistency of return over time. We use themes for both positive and negative screening within our strategies. While important to focus in on themes for selection, we believe it is equally important to actively eliminate stocks through a quality overlay.2 The themes used primarily for selection are: Shareholder Yield, Dividend Yield, Value, and Momentum. The themes used to avoid stocks for selection are Financial Strength, Earnings Quality, and Earnings Growth.3
To level-set the analysis, we ranked each stock in our universe of Large Stocks4 based on the selection themes mentioned above. We then form hypothetical decile portfolios5 and observe excess return across the full 1964–2015 period and in each regime. Table 1 shows the excess returns for the “high” and “low” deciles on each theme for the entire 52-year evaluation period. The high deciles are considered to be those positioned most favorably from a characteristic perspective. The high Value decile, for example, represents the cheapest ten percent of stocks in the universe. Conversely, the low Value decile includes stocks that we would consider to be the most expensive.
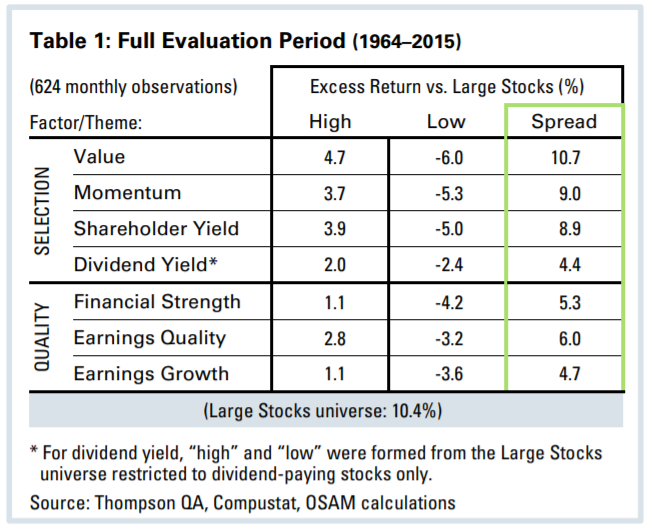
We also include the spread of excess return between the high and low deciles. The high-low spread is a good check for robustness and becomes increasingly important as we compare factor performance in economic regimes. Think of the spread between high and low as a proxy for the value the market places on differentiation by that factor. Using Shareholder Yield as an example, the market rewards an investor’s emphasis on stocks that reward shareholders via dividends and buybacks (high decile) by delivering an 8.9 percent higher annualized return than for stocks that do not pay dividends and dilute shareholders (low decile). Spread serves as a quantitative proxy for active managers’ ability to generate excess return by deviating from the market.
Value, Momentum, and Shareholder Yield are dominant themes, with strong excess return of the high decile and a wide spread (10.7 percent in the case of Value) between the high and low deciles. Each theme provides a different “take” on an individual stock, which is useful in stock selection.
Valuation is representative of the market’s expectation for a stock. Cheap stocks often feature low expectations and, therefore, discounted valuations. As we dive into the research, we will find that differentiation based on valuation is most attractive during times of maximum pessimism.
Momentum exploits a number of behavioral biases—underreaction, overreaction,6 and disposition effects7 —in order to identify stocks having consistent and upwardly trending price movement. As we will see, Momentum tends not to work well at inflection points in the cycle but it does seem to work exceptionally well in high return and trending markets.
Shareholder Yield represents a total return of capital to shareholders. It consists of a stock’s dividend yield and net buyback activity over the previous 12 months. We believe that stocks with high Shareholder Yield tend to be conservative capital allocators and good shepherds of shareholder assets. Similar to Value, the factor theme not only does well during challenging times (in and around recessions) but also produces strong risk-adjusted return throughout the various regimes.
Dividend yield is an interesting factor because it tends to move in and out of favor over time to a greater extent than the other selection themes. In implementation, we believe dividend yield is most effective when paired with Value and Quality to smooth the gyrations over time.
The Quality themes of Financial Strength, Earnings Quality, and Earnings Growth tend to offer lower excess return in the high deciles but interact well with the other selection themes when the low deciles are avoided.
Pre-Recession: Own Expensive Stocks at Your Peril
Since 1979, the NBER has tracked the formal announcement date of their designation of a turning point in the economic cycle. Announcements typically occur 6–12 months after a recession begins, but can take longer. Even though official determinations lag behind, the market seems to have a sense for recession well in advance.
In the 12 months preceding recessions, the Large Stocks universe was effectively flat, having delivered an annualized return of -0.5 percent. In economic cycle parlance, these periods would be analogous to late-stage Expansion.
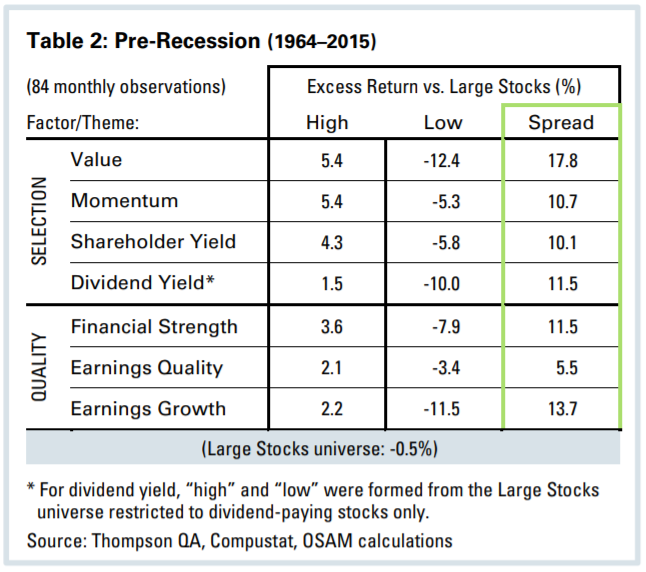
Striking in the Pre-Recession periods is the strong high-low spread for Value of 17.8 percent, which suggests that investors shun expensive stocks when economic growth is in question. In fact, across the various regimes in our study, the low Value (expensive) decile excess return of -12.4 percent is the lowest.
The trend of expensive stocks underperforming starts well in advance of an official recession and extends through the early recovery Post-Recession regime. Not only do these stocks deliver poor excess and absolute return, they tend to exhibit extreme volatility. While high Value (cheap) stocks had a standard deviation of just 14.8 percent annualized, low Value (expensive) stocks had a standard deviation of 30.3 percent.
Momentum and Shareholder Yield also exhibit strong high-low spreads and deliver solid excess return. High Momentum stocks do well in these environments as the last vestiges of the bull market runs its course. Similarly, low Earnings Growth stocks—unprofitable with poor earnings trends—are significantly punished by the market having excess of -11.5 percent.
Investors also seem to prefer stocks with strong balance sheets during the Pre-Recession regime. The high-low spread for Financial Strength more than doubles the 1964–2015 average (from 5.3 percent to 11.5 percent). Though high dividend yield is not one of the stronger factors preceding a recession, the avoidance of low dividend yield seems to be important (-10.0 percent excess).
Recession: Seek Companies Returning Capital to Shareholders
Across the 83 months within the seven recessions, the Large Stocks universe declined an annualized 4.7 percent as the market rightly anticipated economic uncertainty. In this regime, Yield was the clear winner on the basis of excess return. Stocks in the high decile of Shareholder Yield produced 7.0 percent annualized excess return, while high dividend yield generated 4.9 percent of excess. The high-low spread widens significantly for both themes when compared with their 1964–2015 average.
As believers in the virtue of strong shareholder-orientation, it makes sense to us that the market would reward stocks engaging in buyback and dividend activity, as opposed to share issuance and no dividends. Buybacks and dividends necessitate cash, and the ability to distribute cash in times of economic stress is a clear signal of a firm’s strength. Investors seem to be more than happy to accept dividend payments to cushion the blow of stock price depreciation. Further supporting this hypothesis is the continued performance of Financial Strength in recessions as a carry-over from the Pre-Recession regime. Excess return of high Financial Strength remains elevated (3.4 percent) versus the full period trend (1.1 percent) and the high-low spread remains wide at 7.2 percent.
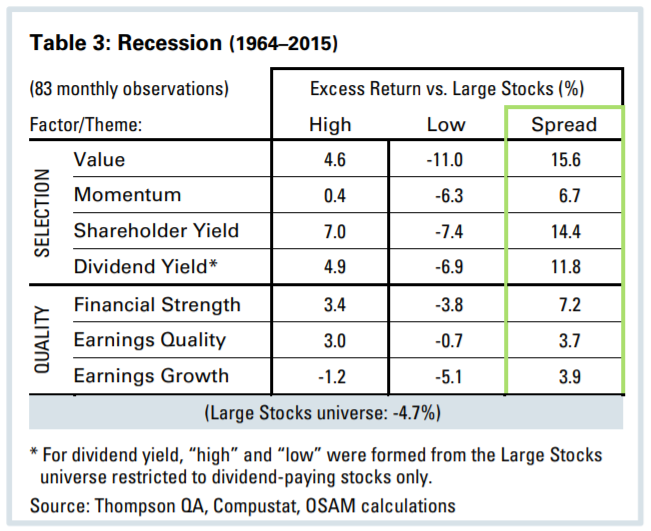
In addition to strong balance sheets and shareholder-orientation in recessions, investors continue to shun expensive stocks. The low Value (expensive) excess of -11.0 percent is one of the worst of all the environments evaluated and the high-low spread of 15.6 percent is second only to Value’s high-low spread in Pre-Recession periods.
Momentum—normally a very robust factor—loses some of its luster in recessions. Given that recessionary periods usually signal a change in leadership, it makes sense that Momentum would struggle around an inflection point. Consistent with other researchers’ findings, we have seen these “momentum inversions” prevail extensively in post-bear market rallies, which periodically coincide with economic recession.8, 9 To the extent that recessions correlate with bear markets, this may explain the decrease in excess return to high Momentum in Table 3. It further argues for pairing Momentum-based strategies with other themes like Value or Quality to increase Momentum’s effectiveness.
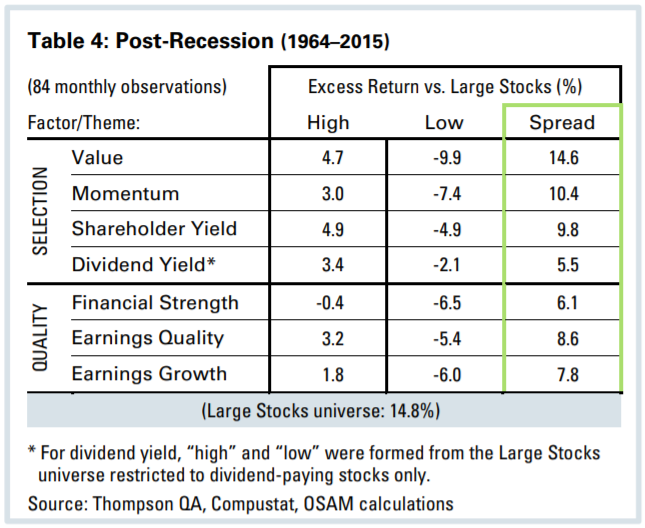
Post-Recession: Shareholder-Orientation Continues to Deliver
Post-Recession periods tend to encapsulate the early stage recovery from economic troughs. These are among the stronger periods for absolute return. Our Large Stocks universe delivered 14.8 percent annualized returns. Yield and Value again dominate the other themes in these environments. The high-low Value spread remains high at 14.6 percent but is down from its Pre-Recession and Recession highs of 17.8 percent and 15.6 percent, respectively. High Financial Strength falls to the back of the pack, delivering marginally negative excess return, as investors likely de-emphasize high balance sheet quality and appropriate leverage in the early stages of a recovery.
The Momentum theme once again asserts itself with the spread widening from 6.7 percent in Recession to 10.4 percent Post-Recession.
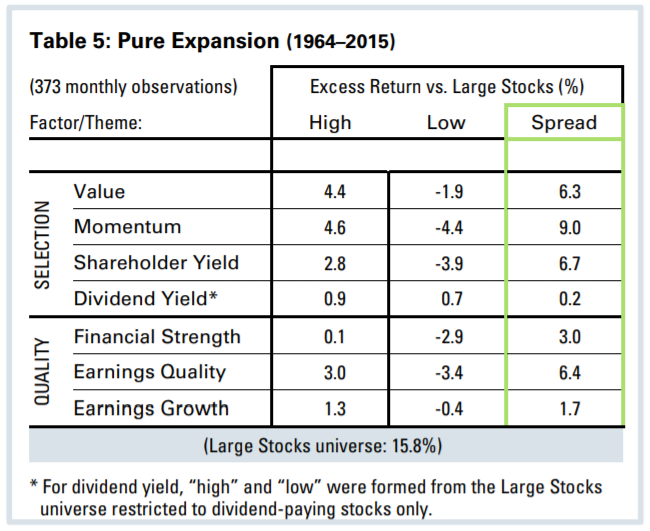
Pure Expansion: Momentum Leads the Pack
Pure Expansion, which lies in between Post-Recession recovery and Pre-Recession late-stage expansion, is the most common at about 60 percent of monthly observations from 1964–2015. Notable in this period is that the high-low spreads are cut in half versus other regimes, whereas the overall market return is highest at 15.8 percent. Momentum—a trend-following factor—rises to the top of the pack based on excess return and high-low spread.
As economic growth takes hold and consumer confidence rises, the market places less emphasis on differentiation, which drives spread compression.10 Intuitively, this makes sense. In periods when market returns are on average negative or the future is uncertain, the ability to generate positive return is predicated on an investor’s skill of choosing wisely. For example, the average market return in recessions is -4.7 percent. High Shareholder Yield delivers excess of 7.0 percent, which translates to a positive absolute return of 2.3 percent. In a raging bull market, when risk concerns slowly fade away (Pure Expansion), differentiation is less important because investors can generate double digit positive return with simple passive beta exposure to the market (see Figure 2).
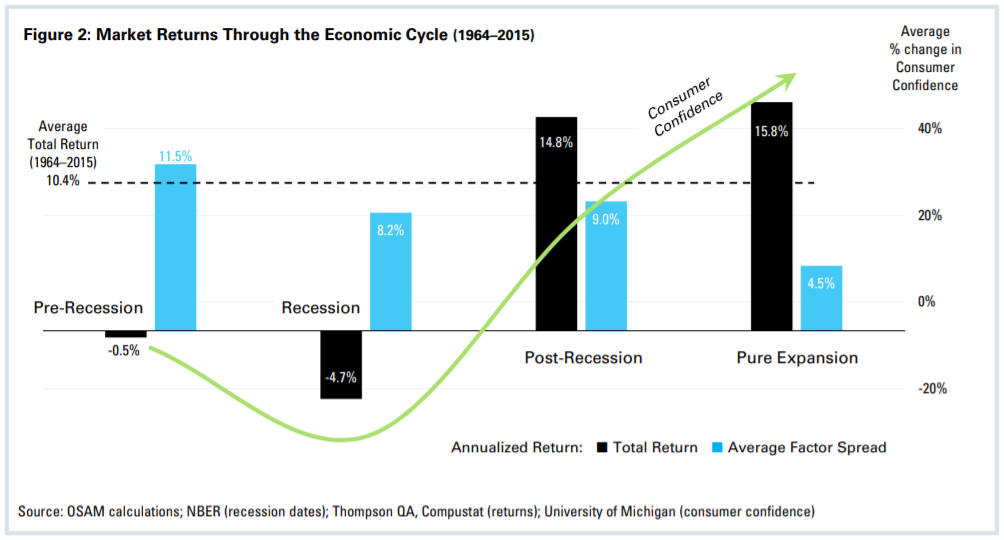
This helps explain why active managers tend to struggle in raging bull markets similar to the one we have experienced since 2009—differentiation is simply not rewarded to the same extent.
Implications for Investors
Though unpredictable, the economic cycle has significant implications for investors. Given the vast amount of evidence that certain themes consistently outperform—and underperform—throughout the cycle, an allocation to passive market cap-weighted indexes seems almost naive.
The information presented here supports an assertion that active management is, at the least, more likely to outperform during turbulent times when factor spreads are wide. Whether any such outperformance is based on luck or skill is up for debate.
Regardless, differentiation based on fundamental factor themes is historically rewarded in a non-linear fashion over the economic cycle. Spread compression in certain environments (Pure Expansion) suggests that generating excess return may be more difficult, while spread expansion in other environments (Pre-Recession, Recession, and Post-Recession) suggests greater opportunity for excess return.
Unfortunately, it just so happens that investors tend to emotionally drawdown equity allocations in the periods when high-low spreads are highest and pile into equities when the spreads are compressing. Rather than attempt to time allocations based on economic indicators that are often outdated, volatile, and revision-prone, we suggest diversifying equity exposure to multiple key selection factors and staying invested throughout the economic cycle.
Realistically though, not every investor can allocate to the high decile of Value, Momentum, or Yield while avoiding low Earnings Quality, Financial Strength, and Earnings Growth. Large asset aggregators have recognized this problem in their attempts to build scalable highly-liquid products that are broadly accessible. In an era of continual fee compression, product sponsors sacrifice potential alpha for scalability. The result is usually a neutered implementation of true factor-based investing that uses factor tilting instead of factor concentration.
As such, most widely-available ETFs and factor implementations will struggle to capture the excess returns discussed in this paper. We view this as the “smart beta” versus “factor alpha” battle.11 We are confident that, in the end, Factor Alpha—concentrated lower-capacity factor exposures—provides significantly greater opportunity for outperformance.
Footnotes:
1 National Bureau of Economic Research “U.S. Business Cycle Expansions and Contractions” http://www.nber.org/cycles.html
2 See “Stocks You Shouldn’t Own” http://osam.com/pdf/Commentary_StocksYouShouldntOwn_Jan-2016.pdf
3 Shareholder Yield is the combination of a stock’s dividend yield and the percentage of shares repurchased over the trailing 12 months. Financial Strength evaluates the appropriateness of a stock’s overall leverage. Earnings Quality measures the conservatism of a stock’s earnings. Earnings Growth reviews profitability and the trend in earnings.
4 We source data from Compustat via Thompson QA. Robust quarterly corporate financial statement data is available starting in 1964. Factor returns are generated from our proprietary Large Stocks universe, which includes all stocks listed on the NYSE, AMEX and NASDAQ with a market cap greater than the inflation-adjusted database average and excluding Utilities. All excess returns are relative to the equal-weighted Large Stocks universe.
5 Decile portfolios are formed on a rolling annual basis and refreshed monthly to avoid the impact of seasonality.
6 Hong, Harrison, and Jeremy C. Stein. “A Unified Theory of Underreaction, Momentum Trading and Overreaction in Asset Markets” (1999)
7 Disposition effect: the behavioral phenomenon whereby investors tend to hold on to losers and sell winners quickly.
8 See “The Same Old Bear: A Study of Bear Markets and Stock Returns Since 1926” http://www.osam.com/pdf/Commentary_Jan10.pdf
9 See also “Momentum Crashes” (2013) http://ssrn.com/abstract=2371227
10 We find spread compression to be statistically significant at the 1% level for all factor themes across all regimes.
11 See “Alpha or Assets? Factor Alpha vs. Smart Beta” http://osam.com/Pdf/Commentary_AlphaOrAssets_FactorAlphaVersusSmartBeta_April-2016.pdf
General Legal Disclosures & Hypothetical and/or Backtested Results Disclaimer
The material contained herein is intended as a general market commentary. Opinions expressed herein are solely those of O’Shaughnessy Asset Management, LLC and may differ from those of your broker or investment firm.
Please remember that past performance may not be indicative of future results. Different types of investments involve varying degrees of risk, and there can be no assurance that the future performance of any specific investment, investment strategy, or product (including the investments and/or investment strategies recommended or undertaken by O’Shaughnessy Asset Management, LLC), or any non-investment related content, made reference to directly or indirectly in this piece will be profitable, equal any corresponding indicated historical performance level(s), be suitable for your portfolio or individual situation, or prove successful. Due to various factors, including changing market conditions and/or applicable laws, the content may no longer be reflective of current opinions or positions. Moreover, you should not assume that any discussion or information contained in this piece serves as the receipt of, or as a substitute for, personalized investment advice from O’Shaughnessy Asset Management, LLC. Any individual account performance information reflects the reinvestment of dividends (to the extent applicable), and is net of applicable transaction fees, O’Shaughnessy Asset Management, LLC’s investment management fee (if debited directly from the account), and any other related account expenses. Account information has been compiled solely by O’Shaughnessy Asset Management, LLC, has not been independently verified, and does not reflect the impact of taxes on non-qualified accounts. In preparing this report, O’Shaughnessy Asset Management, LLC has relied upon information provided by the account custodian. Please defer to formal tax documents received from the account custodian for cost basis and tax reporting purposes. Please remember to contact O’Shaughnessy Asset Management, LLC, in writing, if there are any changes in your personal/financial situation or investment objectives for the purpose of reviewing/evaluating/revising our previous recommendations and/or services, or if you want to impose, add, or modify any reasonable restrictions to our investment advisory services. Please Note: Unless you advise, in writing, to the contrary, we will assume that there are no restrictions on our services, other than to manage the account in accordance with your designated investment objective. Please Also Note: Please compare this statement with account statements received from the account custodian. The account custodian does not verify the accuracy of the advisory fee calculation. Please advise us if you have not been receiving monthly statements from the account custodian. Historical performance results for investment indices and/or categories have been provided for general comparison purposes only, and generally do not reflect the deduction of transaction and/or custodial charges, the deduction of an investment management fee, nor the impact of taxes, the incurrence of which would have the effect of decreasing historical performance results. It should not be assumed that your account holdings correspond directly to any comparative indices. To the extent that a reader has any questions regarding the applicability of any specific issue discussed above to his/her individual situation, he/she is encouraged to consult with the professional advisor of his/her choosing. O’Shaughnessy Asset Management, LLC is neither a law firm nor a certified public accounting firm and no portion of the newsletter content should be construed as legal or accounting advice. A copy of the O’Shaughnessy Asset Management, LLC’s current written disclosure statement discussing our advisory services and fees is available upon request.
The risk-free rate used in the calculation of Sortino, Sharpe, and Treynor ratios is 5%, consistently applied across time.
The universe of All Stocks consists of all securities in the Chicago Research in Security Prices (CRSP) dataset or S&P Compustat Database (or other, as noted) with inflation-adjusted market capitalization greater than $200 million as of most recent year-end. The universe of Large Stocks consists of all securities in the Chicago Research in Security Prices (CRSP) dataset or S&P Compustat Database (or other, as noted) with inflation-adjusted market capitalization greater than the universe average as of most recent year-end. The stocks are equally weighted and generally rebalanced annually.
Hypothetical performance results shown on the preceding pages are backtested and do not represent the performance of any account managed by OSAM, but were achieved by means of the retroactive application of each of the previously referenced models, certain aspects of which may have been designed with the benefit of hindsight.
The hypothetical backtested performance does not represent the results of actual trading using client assets nor decision-making during the period and does not and is not intended to indicate the past performance or future performance of any account or investment strategy managed by OSAM. If actual accounts had been managed throughout the period, ongoing research might have resulted in changes to the strategy which might have altered returns. The performance of any account or investment strategy managed by OSAM will differ from the hypothetical backtested performance results for each factor shown herein for a number of reasons, including without limitation the following:
- Although OSAM may consider from time to time one or more of the factors noted herein in managing any account, it may not consider all or any of such factors. OSAM may (and will) from time to time consider factors in addition to those noted herein in managing any account.
- OSAM may rebalance an account more frequently or less frequently than annually and at times other than presented herein.
- OSAM may from time to time manage an account by using non-quantitative, subjective investment management methodologies in conjunction with the application of factors.
- The hypothetical backtested performance results assume full investment, whereas an account managed by OSAM may have a positive cash position upon rebalance. Had the hypothetical backtested performance results included a positive cash position, the results would have been different and generally would have been lower.
- The hypothetical backtested performance results for each factor do not reflect any transaction costs of buying and selling securities, investment management fees (including without limitation management fees and performance fees), custody and other costs, or taxes – all of which would be incurred by an investor in any account managed by OSAM. If such costs and fees were reflected, the hypothetical backtested performance results would be lower.
- The hypothetical performance does not reflect the reinvestment of dividends and distributions therefrom, interest, capital gains and withholding taxes.
- Accounts managed by OSAM are subject to additions and redemptions of assets under management, which may positively or negatively affect performance depending generally upon the timing of such events in relation to the market’s direction.
- Simulated returns may be dependent on the market and economic conditions that existed during the period. Future market or economic conditions can adversely affect the returns.


