Tax Management and Canvas
By OSAM Research Team
April 2021
OSAM has a long history of managing factor-based investment strategies in a manner that reduces real-world costs and delivers strong investment results. Since the inception of our firm, tax management has been an integral component of the portfolio management process because we understand how taxes can drag on investment results.
We built Canvas, a web-based platform enabling financial advisors to build Custom Indexes, on top of our factor expertise, sophisticated risk modeling, and proprietary SMA infrastructure, powering us to efficiently and effectively manage client accounts to individual tax parameters.
Our tax management and tax loss harvesting (TLH) process aims to reduce the impact of taxes on returns by:
1. Realizing taxable gains on a long-term, as opposed to short-term, basis to benefit from the lower long-term tax rate;
2. Opportunistically trading preferable tax lots that lessen the net tax impact—i.e. pairing gains with losses where possible;
3. Avoiding wash sales;
4. Having an awareness of dividend payments and their tax effects;
5. Transitioning portfolios in a tax-friendly manner from a current to desired state (where applicable).
From a single separately managed Canvas account, these tax considerations can be applied to a fully passive, fully active, or blended allocation customizable by market cap, geography, factor, and include personal restrictions such as Social Responsibility, ESG, or individual stocks.
THE ADVANTAGE OF SEPARATELY MANAGED ACCOUNTS
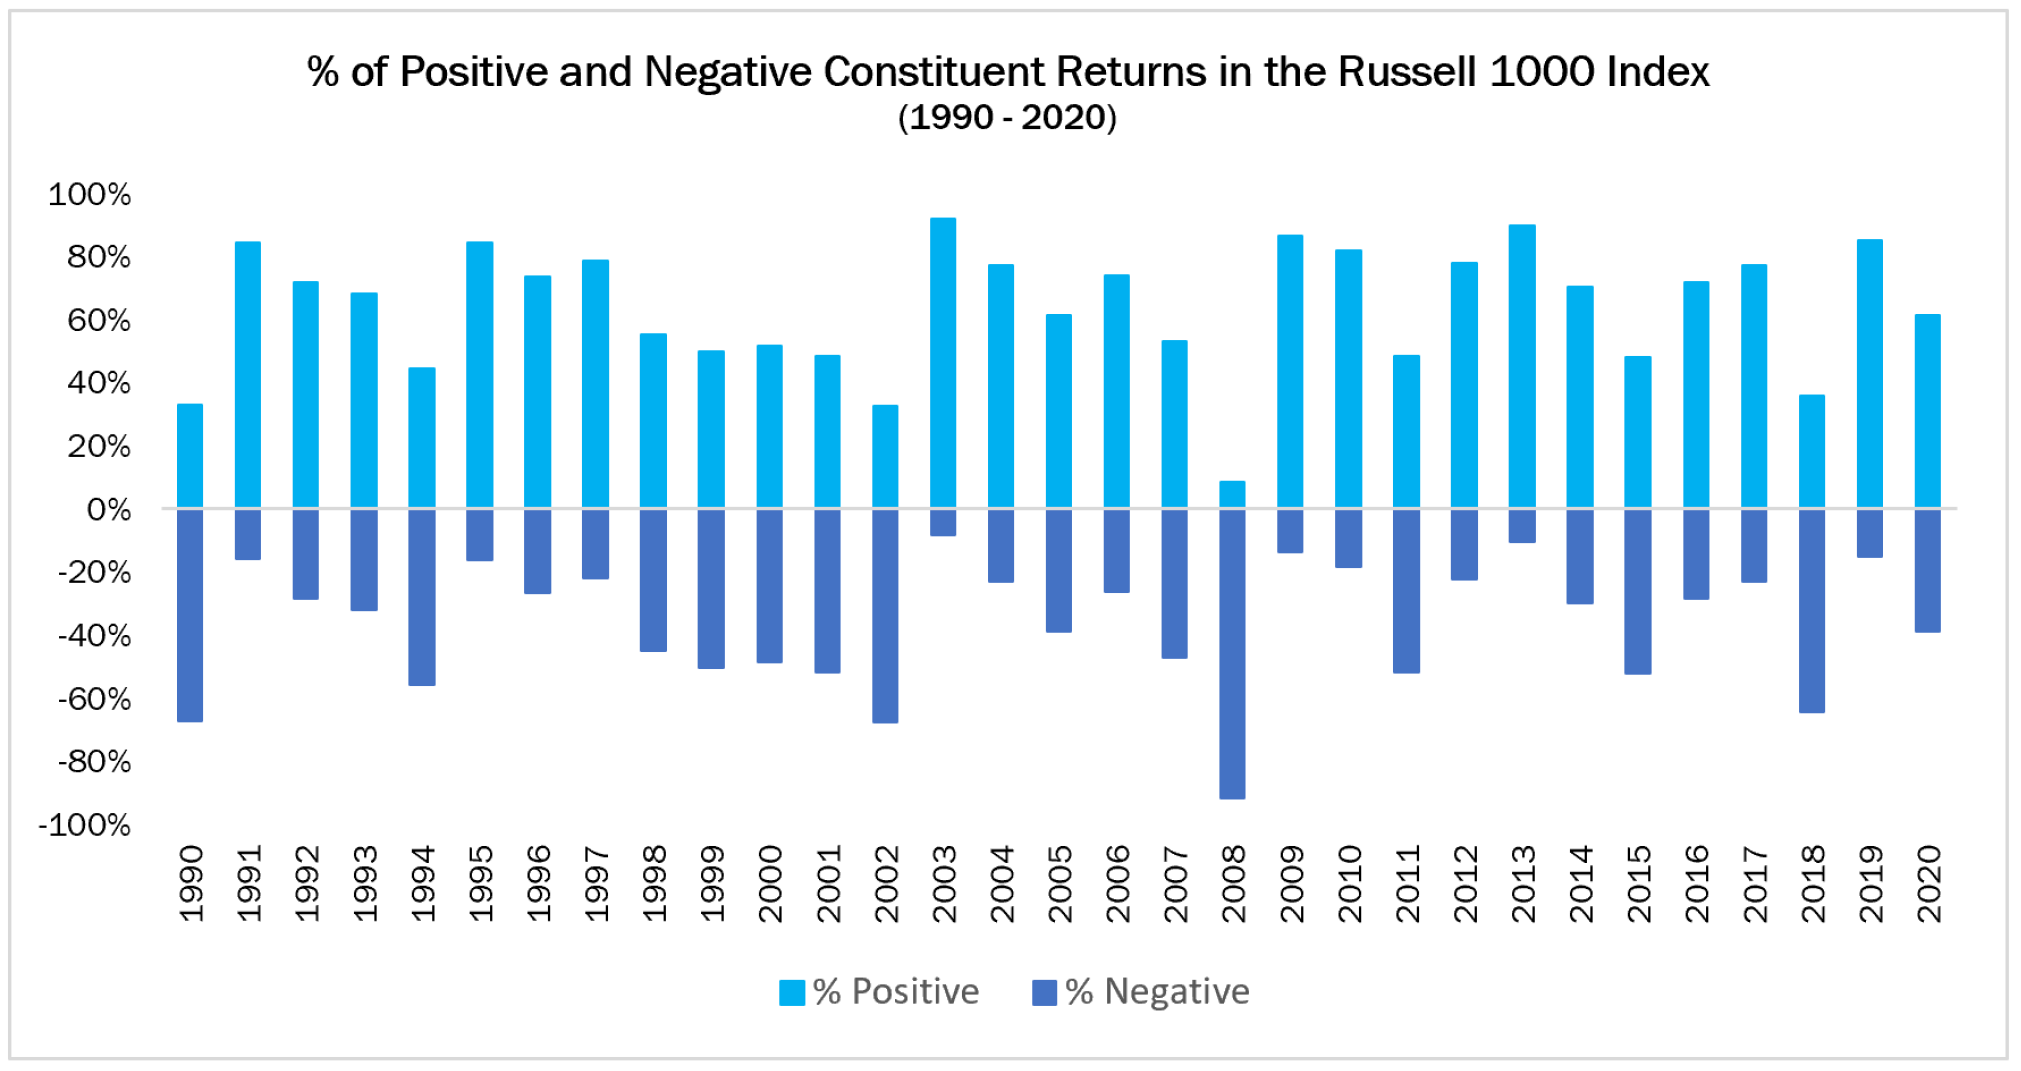
Mutual funds and ETFs are efficient vehicles for obtaining broad market exposure but are less tax-efficient than commonly perceived. Because ETF and fund investors do not own the underlying securities, they are not able to benefit from opportunistic tax loss harvesting. Even though the stock market rises in about 71% of calendar years, roughly 36% of individual stocks deliver negative returns annually. The ability to harvest these losses accrues to a significant tax asset over time—even relative to tax efficient ETFs.
HOW WE TAX-MANAGE CANVAS PORTFOLIOS
Long-term investors desiring to change allocations are often caught between the immediate tax costs of an allocation change and the potential benefit from the trade (stronger future returns, lower tracking error, increased diversification, etc.). We often refer to this as the “tax tail” wagging the “investment dog.” Unfortunately, the tax tail can incur formidable costs. Applying tax management during a transition and on an ongoing basis helps mitigate these costs. For Canvas accounts, we apply a simple 4-step process:
1. We invest the portfolio while being mindful of tax impact during the transition from an existing portfolio. That means providing cost/benefit analysis for the portfolio transition and creating a plan to transition over time if appropriate.
2. We regularly evaluate the portfolio for tax loss harvesting opportunities. Parameters can be set to manage to an annual tax budget or tolerance threshold that allows us to deviate from the portfolio’s strategy model to capture as many losses as possible.
3. We reinvest proceeds from tax loss harvesting with an awareness of wash sale rules and to maintain target allocations, factor tilts, and risk exposures.
4. We use accumulated losses to offset realized gains, lowering or eliminating the client’s tax bill.
MEASURING THE IMPACT OF TAX MANAGEMENT
To put our tax harvesting strategy to the test, we ran it through our tax-lot level research framework. The framework provides daily accounting for all positions at the share and lot-level, incorporates real world transaction costs, and utilizes the elements of the management process described in the last section. Because after-tax results are highly dependent on the fluctuations in stock markets, we ran 16 ten-year simulations starting in 1994 through 2009 to see if different market environments impacted the ability to add after-tax value. For the purposes of our analysis, we applied current maximum tax rates.1
THE RESULT
Our research suggests that the Canvas tax loss harvesting capabilities can potentially add somewhere between 0.5-1.0% of annual after-tax return versus passive ETF strategies.2 Specifically, the drawdown in 2020 was a boon for tax loss harvesting and we were able to generate $250,000 of losses on a $1,000,000 U.S. Large Cap Direct Index equating to a tax offset of $100,000.
If you’d like to learn more about Canvas tax management, Click Here to Sign-Up For Your Demo Today.
1 42.4% on Short-Term Capital Gains, 23.8% on Long-Term Capital Gains, Dividends taxed at a 20% rate. State and city-level considerations are not applied to the analysis.
2 Based on a passive U.S. Large Cap Direct Index strategy compared to the SPY ETF.
GENERAL LEGAL DISCLOSURES & HYPOTHETICAL AND/OR BACKTESTED RESULTS DISCLAIMER
The material contained herein is intended as a general market commentary. Opinions expressed herein are solely those of O’Shaughnessy Asset Management, LLC and may differ from those of your broker or investment firm.
Please remember that past performance may not be indicative of future results. Different types of investments involve varying degrees of risk, and there can be no assurance that the future performance of any specific investment, investment strategy, or product (including the investments and/or investment strategies recommended or undertaken by O’Shaughnessy Asset Management, LLC), or any non-investment related content, made reference to directly or indirectly in this piece will be profitable, equal any corresponding indicated historical performance level(s), be suitable for your portfolio or individual situation, or prove successful. Due to various factors, including changing market conditions and/or applicable laws, the content may no longer be reflective of current opinions or positions. Moreover, you should not assume that any discussion or information contained in this piece serves as the receipt of, or as a substitute for, personalized investment advice from O’Shaughnessy Asset Management, LLC. Any individual account performance information reflects the reinvestment of dividends (to the extent applicable), and is net of applicable transaction fees, O’Shaughnessy Asset Management, LLC’s investment management fee (if debited directly from the account), and any other related account expenses. Account information has been compiled solely by O’Shaughnessy Asset Management, LLC, has not been independently verified, and does not reflect the impact of taxes on non-qualified accounts. In preparing this report, O’Shaughnessy Asset Management, LLC has relied upon information provided by the account custodian. Please defer to formal tax documents received from the account custodian for cost basis and tax reporting purposes. Please remember to contact O’Shaughnessy Asset Management, LLC, in writing, if there are any changes in your personal/financial situation or investment objectives for the purpose of reviewing/evaluating/revising our previous recommendations and/or services, or if you want to impose, add, or modify any reasonable restrictions to our investment advisory services. Please Note: Unless you advise, in writing, to the contrary, we will assume that there are no restrictions on our services, other than to manage the account in accordance with your designated investment objective. Please Also Note: Please compare this statement with account statements received from the account custodian. The account custodian does not verify the accuracy of the advisory fee calculation. Please advise us if you have not been receiving monthly statements from the account custodian. Historical performance results for investment indices and/or categories have been provided for general comparison purposes only, and generally do not reflect the deduction of transaction and/or custodial charges, the deduction of an investment management fee, nor the impact of taxes, the incurrence of which would have the effect of decreasing historical performance results. It should not be assumed that your account holdings correspond directly to any comparative indices. To the extent that a reader has any questions regarding the applicability of any specific issue discussed above to his/her individual situation, he/she is encouraged to consult with the professional advisor of his/her choosing. O’Shaughnessy Asset Management, LLC is neither a law firm nor a certified public accounting firm and no portion of the newsletter content should be construed as legal or accounting advice. A copy of the O’Shaughnessy Asset Management, LLC’s current written disclosure statement discussing our advisory services and fees is available upon request
The risk-free rate used in the calculation of Sortino, Sharpe, and Treynor ratios is 5%, consistently applied across time
The universe of All Stocks consists of all securities in the Chicago Research in Security Prices (CRSP) dataset or S&P Compustat Database (or other, as noted) with inflation-adjusted market capitalization greater than $200 million as of most recent year-end. The universe of Large Stocks consists of all securities in the Chicago Research in Security Prices (CRSP) dataset or S&P Compustat Database (or other, as noted) with inflation-adjusted market capitalization greater than the universe average as of most recent year-end. The stocks are equally weighted and generally rebalanced annually
Hypothetical performance results shown on the preceding pages are backtested and do not represent the performance of any account managed by OSAM, but were achieved by means of the retroactive application of each of the previously referenced models, certain aspects of which may have been designed with the benefit of hindsight
The hypothetical backtested performance does not represent the results of actual trading using client assets nor decision-making during the period and does not and is not intended to indicate the past performance or future performance of any account or investment strategy managed by OSAM. If actual accounts had been managed throughout the period, ongoing research might have resulted in changes to the strategy which might have altered returns. The performance of any account or investment strategy managed by OSAM will differ from the hypothetical backtested performance results for each factor shown herein for a number of reasons, including without limitation the following:
- Although OSAM may consider from time to time one or more of the factors noted herein in managing any account, it may not consider all or any of such factors. OSAM may (and will) from time to time consider factors in addition to those noted herein in managing any account.
- OSAM may rebalance an account more frequently or less frequently than annually and at times other than presented herein.
- OSAM may from time to time manage an account by using non-quantitative, subjective investment management methodologies in conjunction with the application of factors.
- The hypothetical backtested performance results assume full investment, whereas an account managed by OSAM may have a positive cash position upon rebalance. Had the hypothetical backtested performance results included a positive cash position, the results would have been different and generally would have been lower.
- The hypothetical backtested performance results for each factor do not reflect any transaction costs of buying and selling securities, investment management fees (including without limitation management fees and performance fees), custody and other costs, or taxes – all of which would be incurred by an investor in any account managed by OSAM. If such costs and fees were reflected, the hypothetical backtested performance results would be lower.
- The hypothetical performance does not reflect the reinvestment of dividends and distributions therefrom, interest, capital gains and withholding taxes.
- Accounts managed by OSAM are subject to additions and redemptions of assets under management, which may positively or negatively affect performance depending generally upon the timing of such events in relation to the market’s direction.
- Simulated returns may be dependent on the market and economic conditions that existed during the period. Future market or economic conditions can adversely affect the returns.
Please Note: Socially Responsible Investing Limitations. Socially Responsible Investing involves the incorporation of Environmental, Social and Governance considerations into the investment due diligence process (“ESG). There are potential limitations associated with allocating a portion of an investment portfolio in ESG securities (i.e., securities that have a mandate to avoid, when possible, investments in such products as alcohol, tobacco, firearms, oil drilling, gambling, etc.). The number of these securities may be limited when compared to those that do not maintain such a mandate. ESG securities could underperform broad market indices. Investors must accept these limitations, including potential for underperformance. Correspondingly, the number of ESG mutual funds and exchange traded funds are few when compared to those that do not maintain such a mandate. As with any type of investment (including any investment and/or investment strategies recommended and/or undertaken by OSAM), there can be no assurance that investment in ESG securities or funds will be profitable, or prove successful.


