Taking Some Chips Off the Table: A Direct to Custom Index Case Study
By Ehren Stanhope
June 2021
Direct Index portfolios have the distinct advantage of matching index performance while generating after-tax alpha, seemingly for “free”. Acute observers know that nothing is actually free. Early adopters of Direct Indexing now face a problem. The longest bull market on record has left their portfolios with significant embedded gains that handcuff them to undesired over/underweights relative to the passive index they seek to replicate.
A client that had been invested with a Direct Index provider recently approached us with a unique ask. After riding the multi-year bull market, they decided that equities were likely fully priced, particularly growth stocks. Typically, one would simply rebalance assets from equities to fixed income or cash, but this would require massive gain realizations as nearly 100% of their underlying Direct Index positions were in a taxable gain position. What might we recommend?
The beauty of Custom Indexing as an investing solution is the flexibility to shift exposures with full transparency into the trade-offs involved. We ultimately recommended a solution that decreased equity risk at minimal cost and actually reduced their tracking error to the original passive index.
Note: While the case below is specific to adding a defensive allocation, other factors – Dividend Growth, Value, Momentum, Shareholder Yield – can be applied with the same transparency into the trade-offs involved.
OBJECTIVE 1: REDUCE EQUITY RISK
Downside protection equity strategies are vast and somewhat nuanced. They typically include some combination of low beta, low volatility, and/or high-quality selection criteria. Investigating the merits of each, we developed our Defensive Stability strategy, which seeks companies ranking high on our Stability theme while avoiding those that rank poorly on our Quality themes.
Stability
In researching the most popular forms of downside protection factor-based strategies, it became clear that the historical results associated with the low volatility “factor” were actually driven by two things: a structural tilt towards cheaper companies; and exposure to companies with low volatility in their fundamentals. Based on this info, we developed a Stability theme that seeks companies with stable operating, management, and price metrics over the trailing five years. Our historical research suggests that greater stability results in positive excess return, lower volatility, downside protection, and a higher Sharpe Ratio. This was an interesting new field of research for us as the goals and objectives of downside protection are different from our Factor Alpha suite—Value, Momentum, and Shareholder Yield. Downside protection strategies generate “alpha” by limiting drawdowns, not through higher upside capture.
Quality
Our Quality themes attempt to ferret out companies with poor operating and financial metrics. We seek to eliminate companies with poor underlying profitability and cash flow trends via Earnings Growth. Our Financial Strength theme eliminates over-levered firms with high reliance on outside sources of capital. Our Earnings Quality theme avoids companies that are using non-cash items to boost earnings. Momentum and Value are also used as screening criteria to eliminate very expensive names, which often carry downside risk, and poor momentum names which tend to continue to perform poorly.
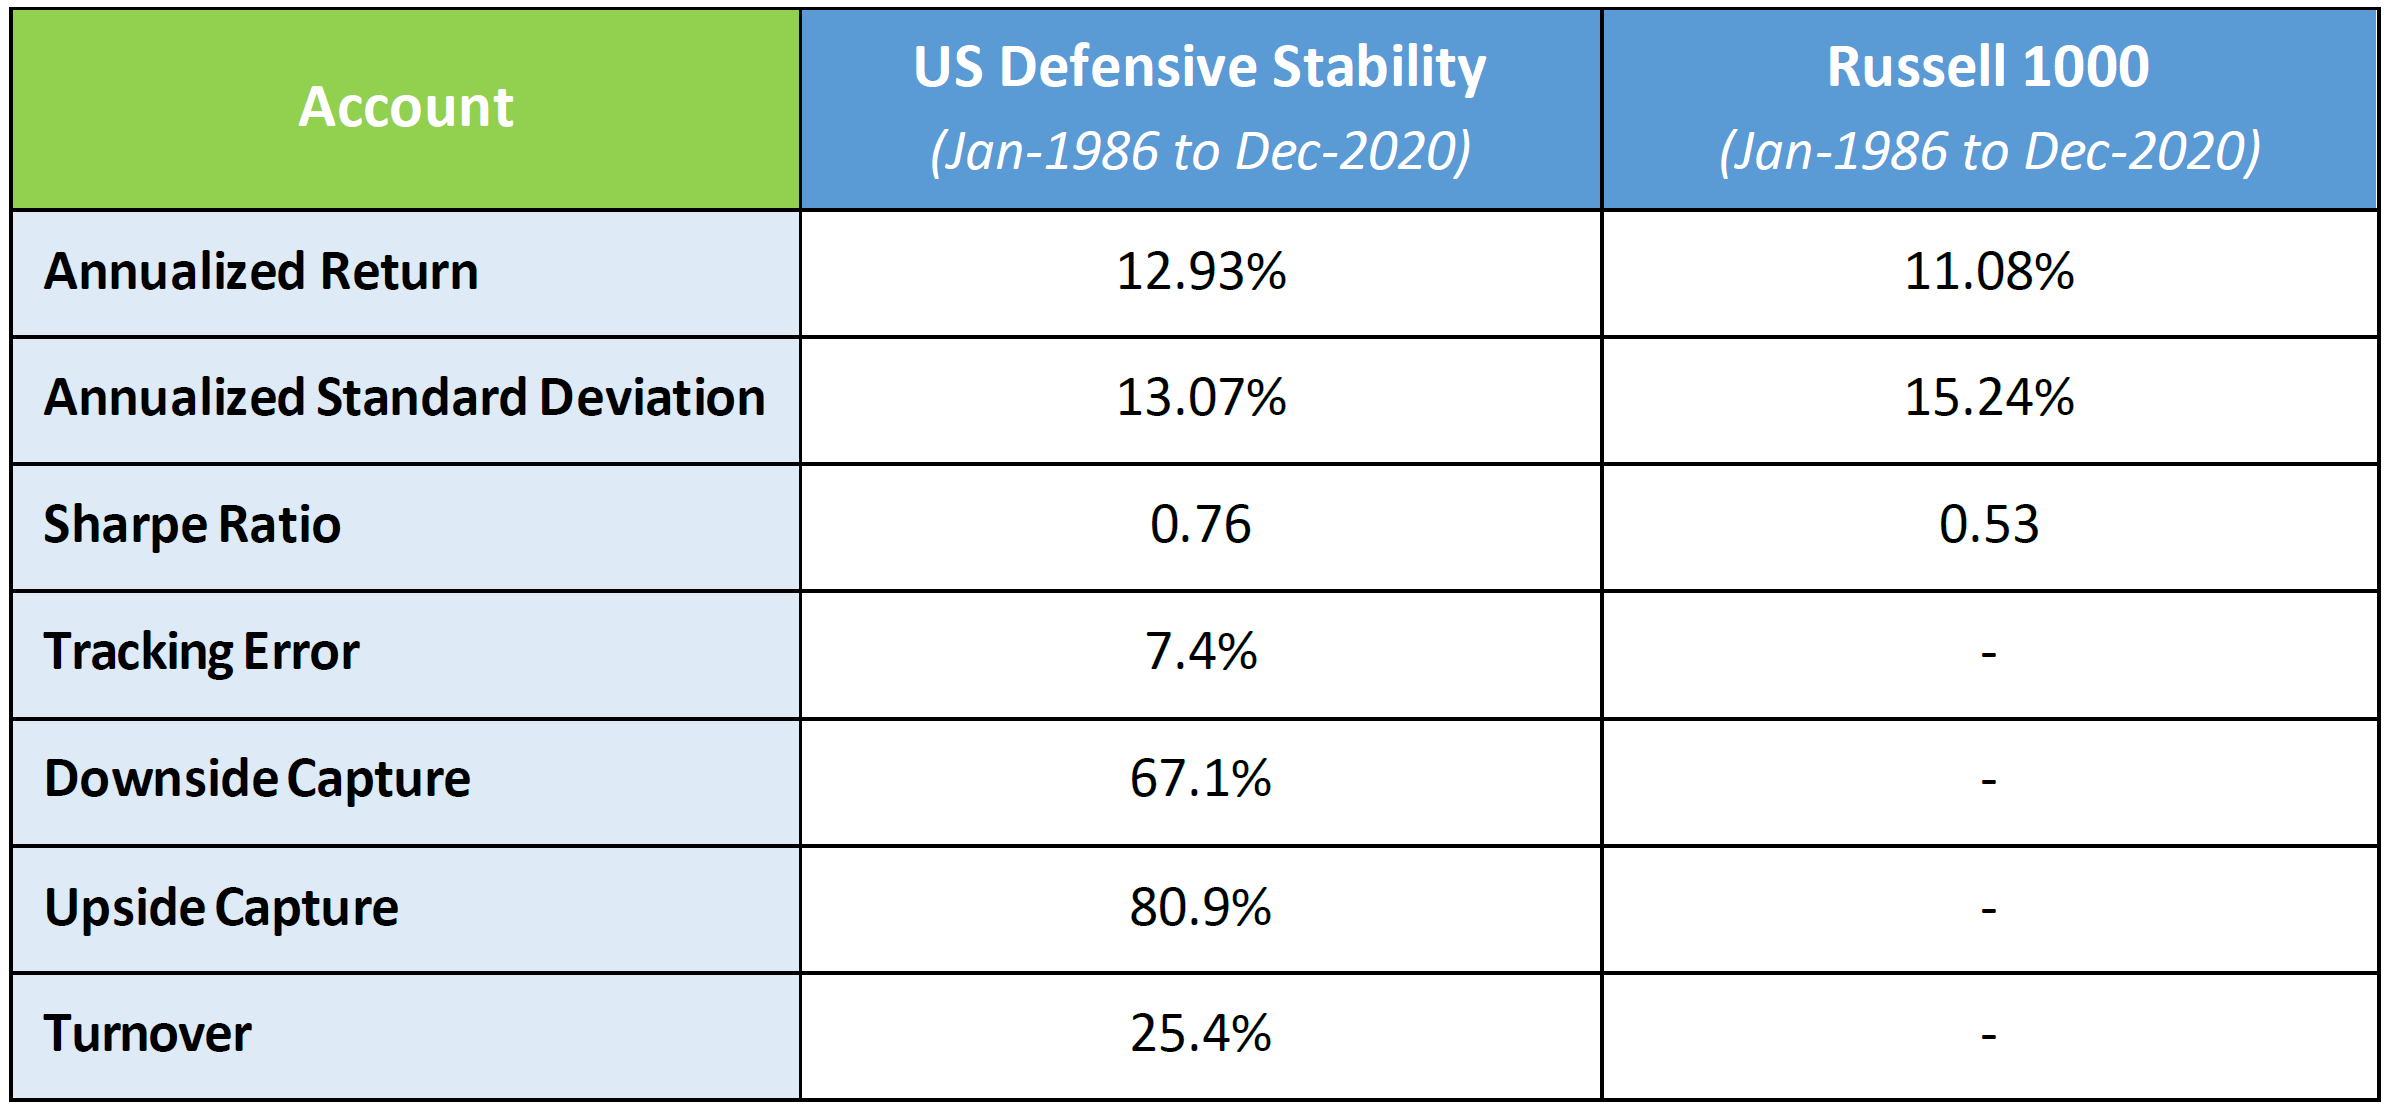
Defensive Stability Strategy
Using a benchmark’s constituents as the starting universe, the Defensive Stability investment process begins by eliminating the lowest-scoring companies across each of our quality themes. From there, the strategy concentrates into the highest-scoring companies as measured by the Stability theme. It then applies risk controls at the position, region, sector, and industry level. Below is a high-level view of the backtested results.
OBJECTIVE 2: DETERMINE ALLOCATION TO DEFENSIVE STABILITY
Due to the significant embedded gains in the client’s current Direct Index, we proposed liquidating a targeted portion of the portfolio and re-allocating to the Defensive Stability exposure. Below, we look at the impact of 5%, 15%, and 25% re-allocations.
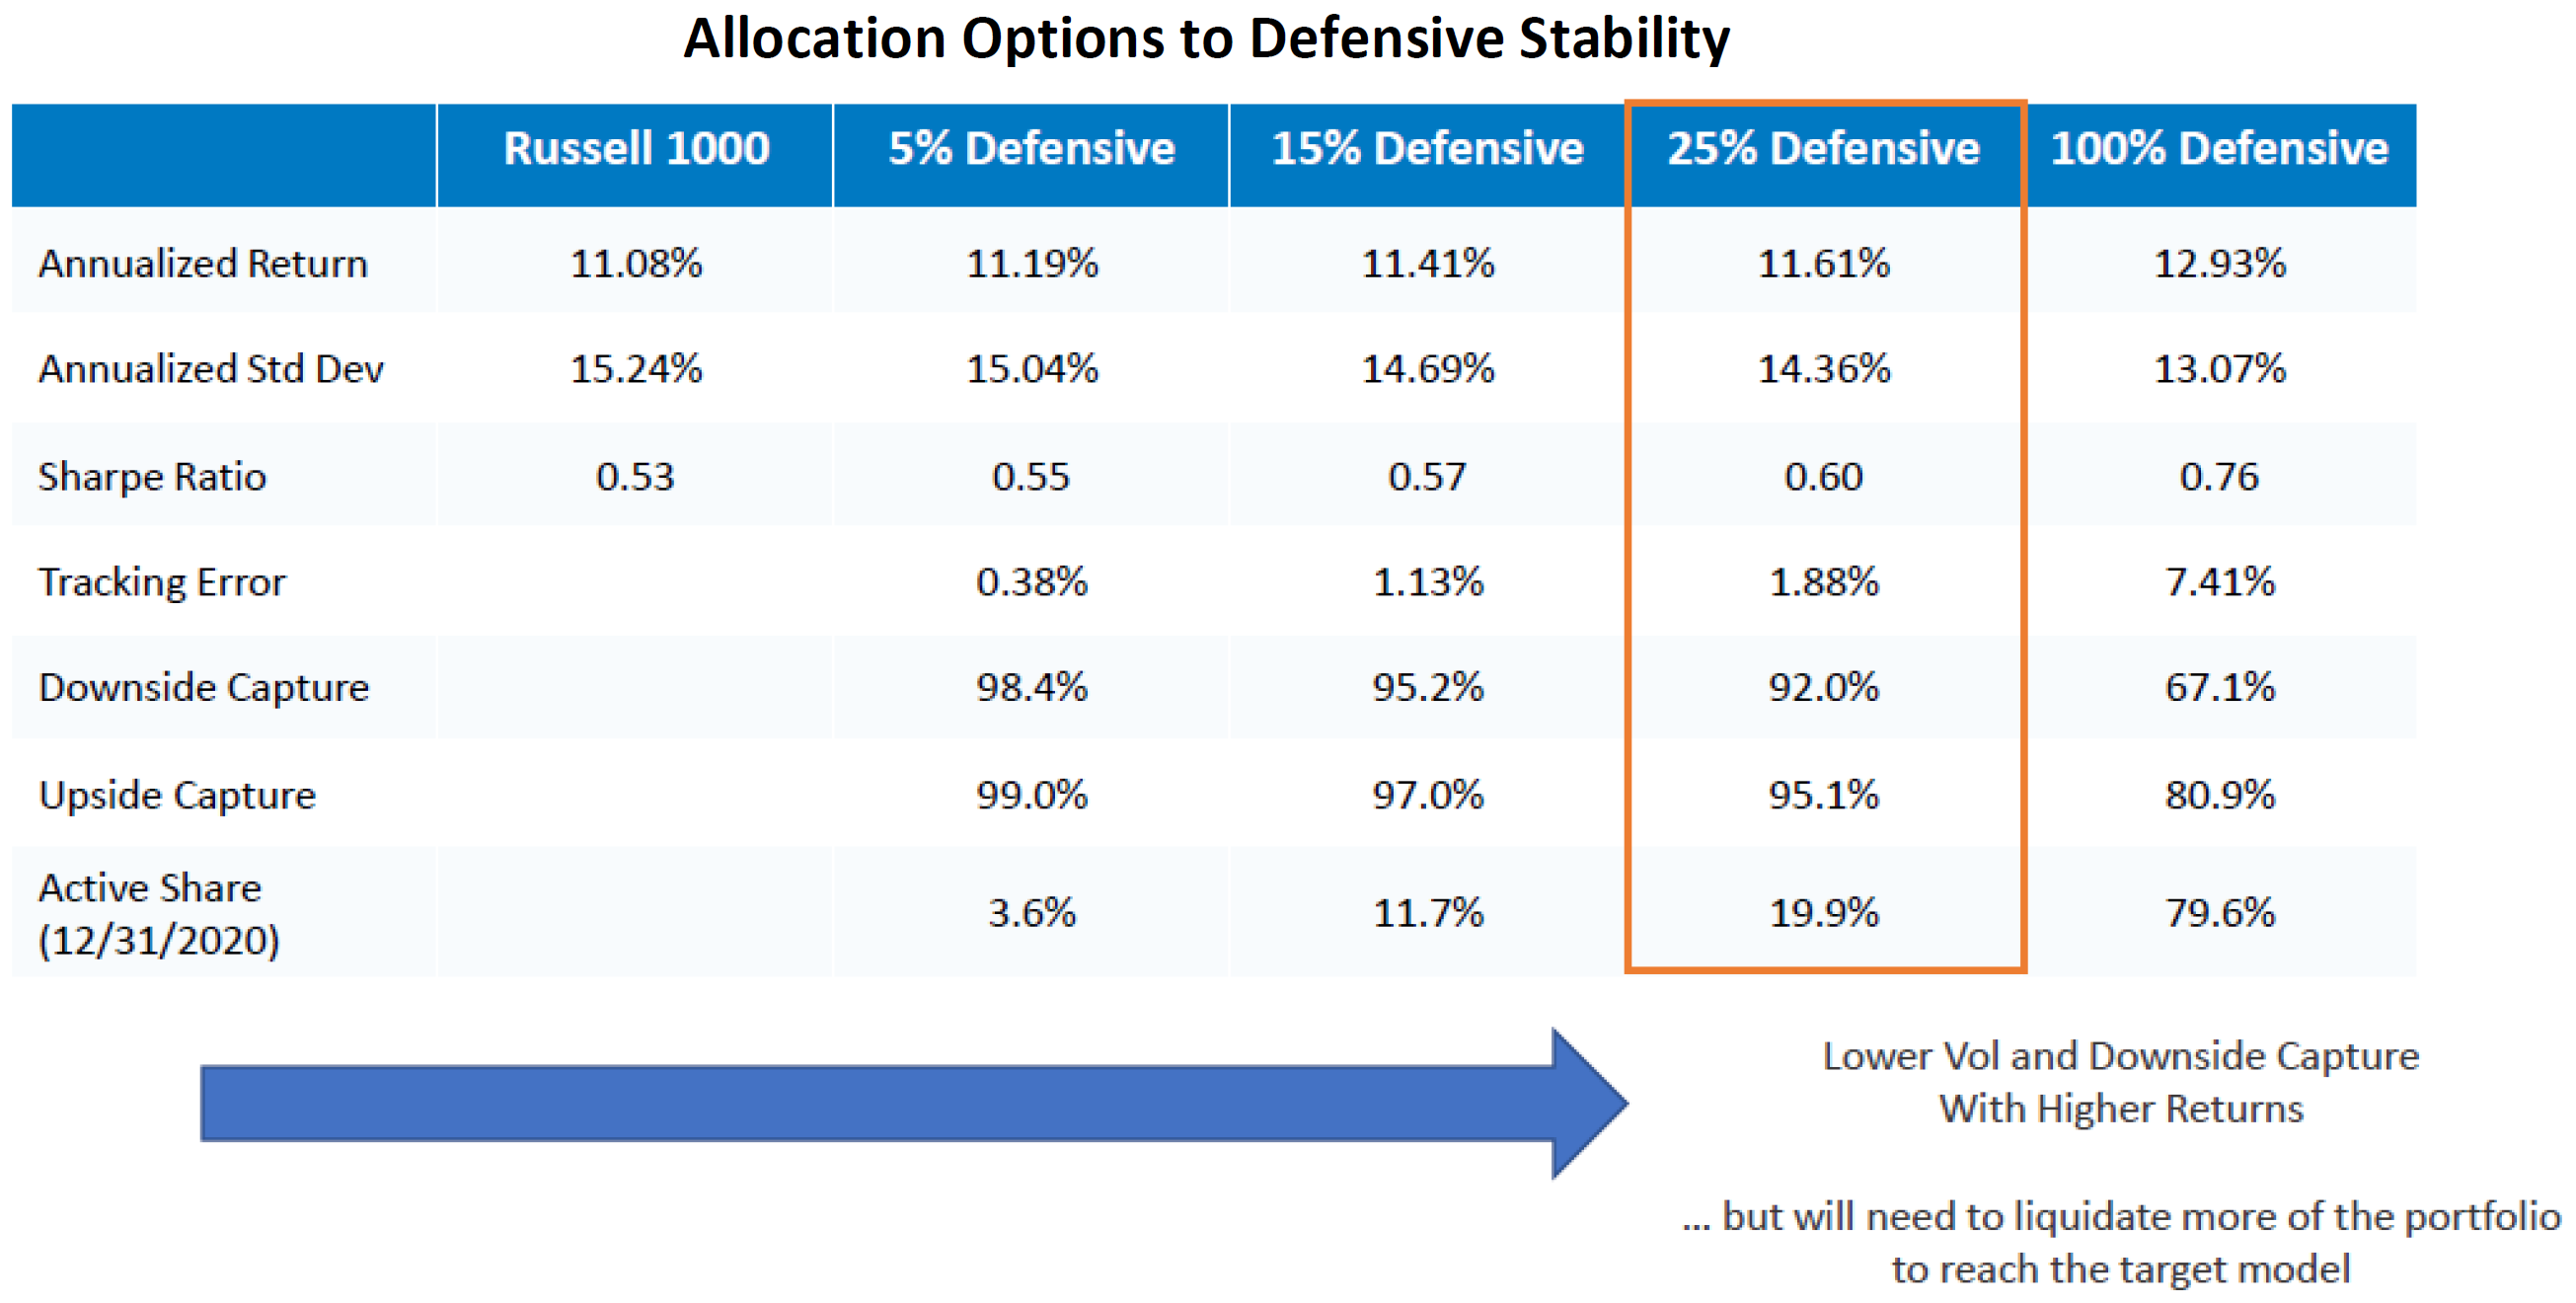
A 75% Passive/25% Defensive Stability allocation was chosen as it improved the portfolio’s upside/downside capture in-line with the client’s desire to “take some chips off the table” but limited turnover and the amount of capital gains realized.
OBJECTIVE 3: TRANSITION WHILE MINIMIZING TAX COST
The third component of the client’s objective was working in Defensive Stability exposure with the lowest possible tax impact. Allocation changes often come with a tax cost but applying tax management during the transition and on an ongoing basis helps mitigate the impact. For Canvas accounts, we apply a simple 4-step process:
1. Invest the portfolio while being mindful of tax impact during the transition from an existing portfolio. This means providing cost/benefit analysis for the portfolio transition and creating a plan to transition over time if appropriate.
2. Regularly evaluate the portfolio for tax loss harvesting opportunities. Parameters can be set to manage to an annual tax budget or tolerance threshold that allows us to deviate from the portfolio’s strategy model to capture as many losses as possible.
3. Reinvest proceeds from tax loss harvesting with an awareness of wash sale rules and to maintain target allocations, factor tilts, and risk exposures.
4. Use accumulated losses to offset realized gains, lowering, or eliminating the client’s tax bill.
We evaluated the incumbent portfolio to determine which tax lots gave us the “biggest bang for our buck”— meaning which tax lots can be liquidated and reinvested to reduce tracking error the most to our target 75% Passive/25% Defensive Stability target.
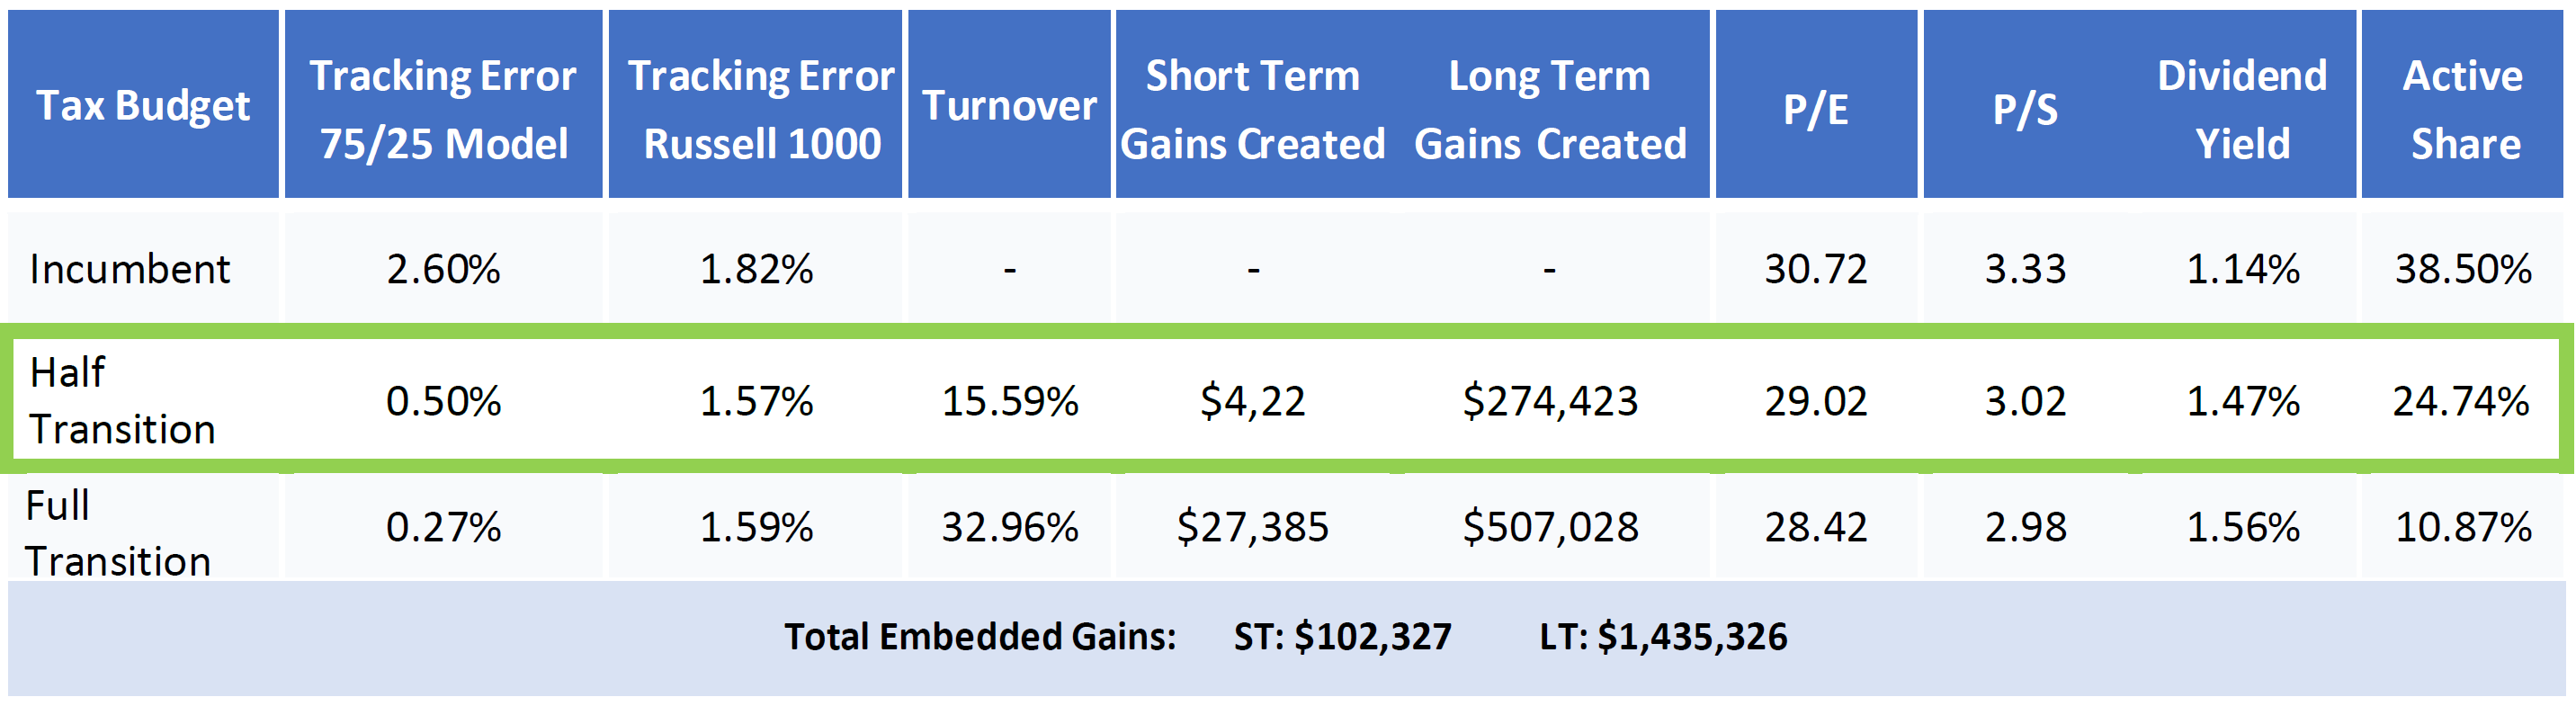
The table below shows projected results of a Half Transition and Full Transition. A Full Transition would realize all gains required to re-allocate to the chosen 25% Defensive Stability exposure. A Half Transition effectively provides a 12.5% exposure to Defensive Stability on day 1, with progress made in the future as loss harvesting opportunities arise from market movement within the client’s annual tax budget and tracking error parameters.
In Canvas, we typically present statistics on the incumbent portfolio and options for an initial transition as it aids the decision-making process. Note in the table below that the incumbent portfolio’s tracking error to the Russell 1000—the passive benchmark it is tracking—has ballooned to 1.82% due the embedded gains in the portfolio.
In this case, a Half Transition would actually reduce the incumbent portfolio’s tracking error to the Russell 1000 from 1.82% to 1.57%, while also aligning it much more closely with the 75%/25% target allocation.
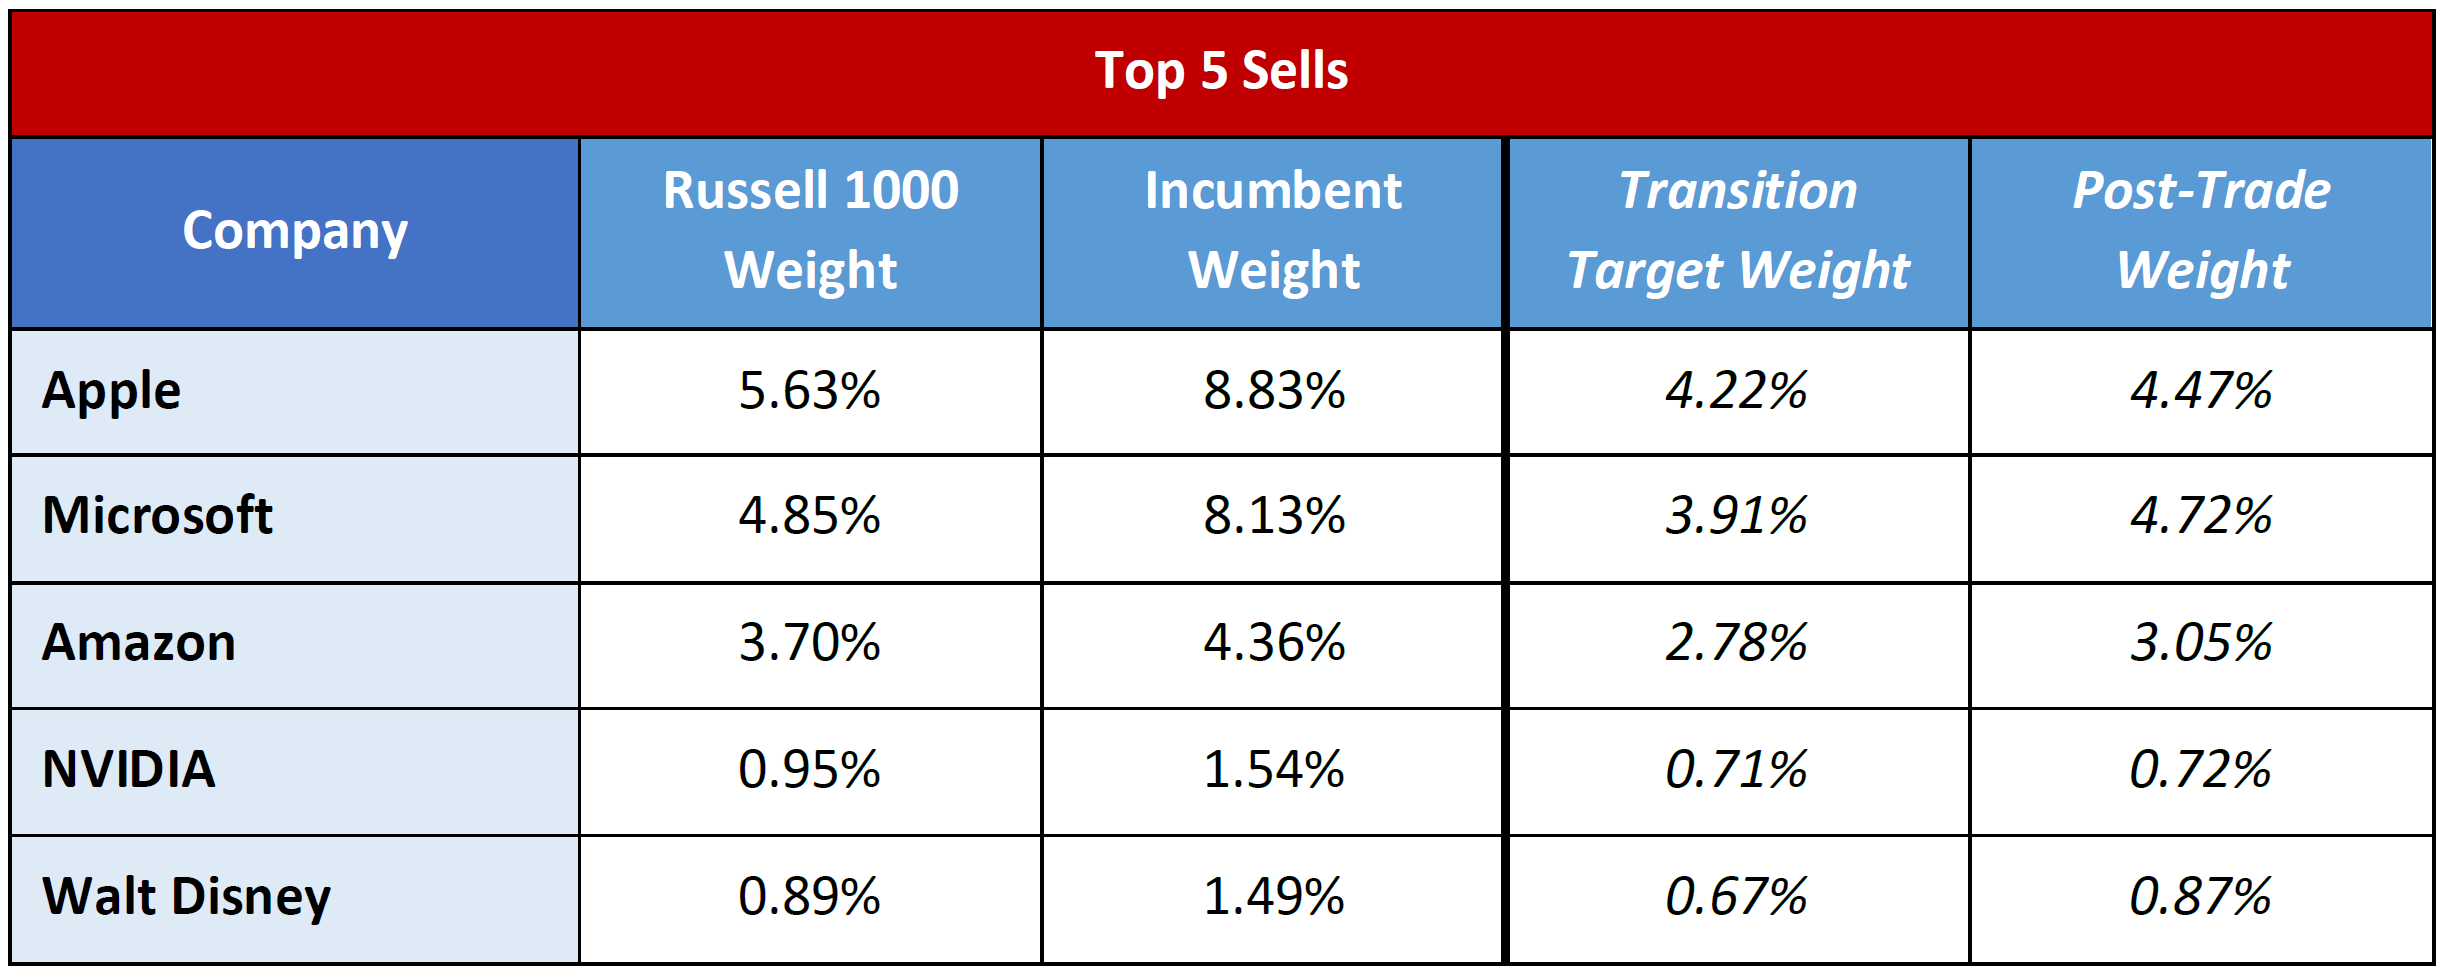
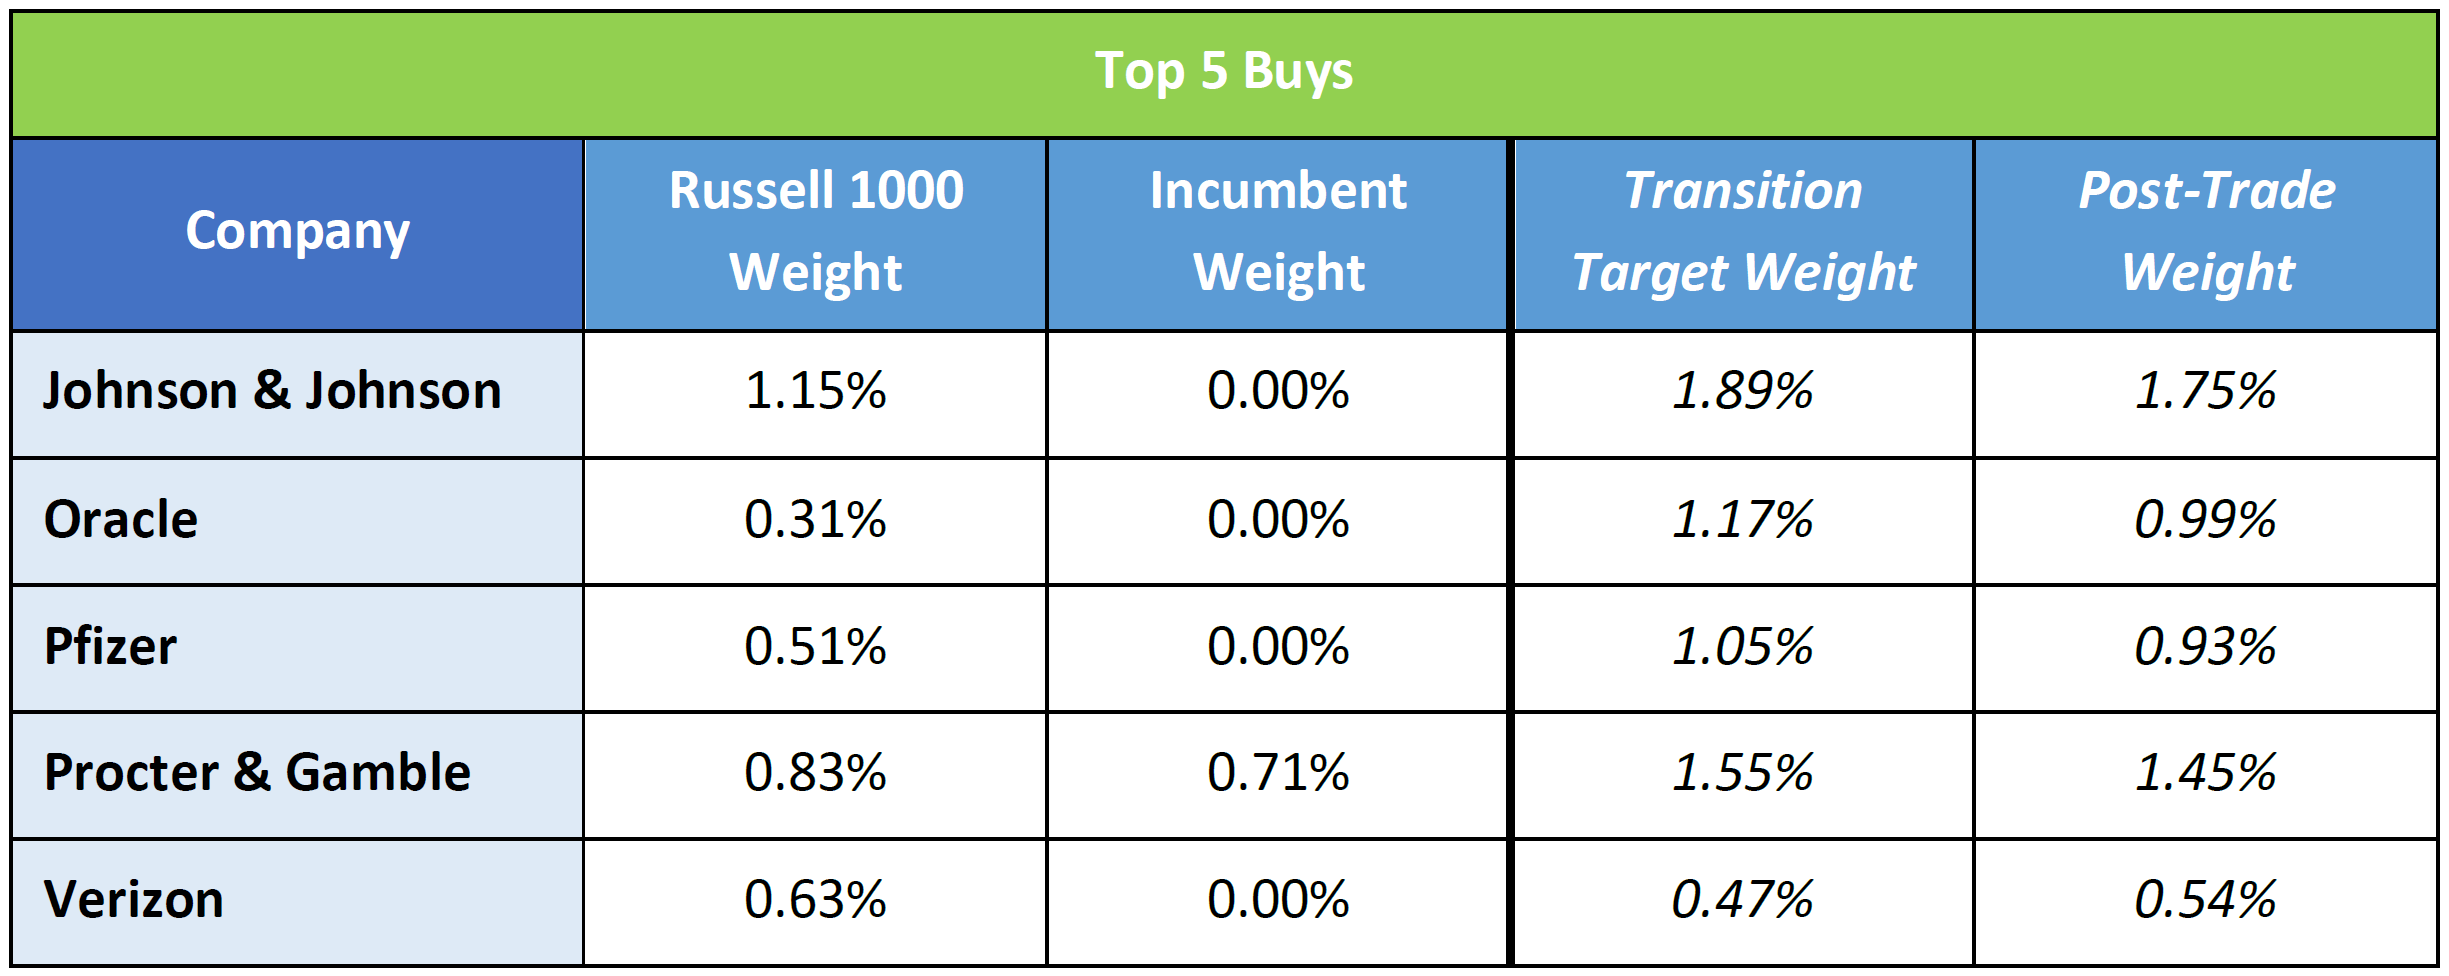
Below are the top sells and buys associated with the Half Transition. Comparing the Russell 1000 and Incumbent weights, it is easy to see how the significant embedded gains in their portfolio were driving a high tracking error to the index (1.82%). Apple and Microsoft were held at nearly 3% overweights—more akin to an active manager than a passive index.
This highlights another key reason the client was looking to shift exposures. Growth stocks have done exceptionally well over the last few years and have been the drivers of total returns and embedded gains. To the extent that they are no longer the drivers of market returns, a Direct Index portfolio stuck in “Tax Lock” carries substantive active risk.
CONCLUSION
The value of a Custom Indexing platform like Canvas lies in its ability to solve for intricate scenarios like the one described. This example also highlights the advantages of Custom Indexing over Direct Indexing.
Using a Custom Indexing solution, the client could easily blend and/or re-allocate their passive exposure to incorporate a more defensive posture. The tax optimizer in Canvas would then execute this re-allocation in a manner that stayed within the client’s set Tax and Tracking Error Budgets. The ability to manage passive and factor-based allocations from one account enables a more holistic and tactical approach to tax management not available in a standalone Direct Index.
GENERAL LEGAL DISCLOSURES & HYPOTHETICAL AND/OR BACKTESTED RESULTS DISCLAIMER
The material contained herein is intended as a general market commentary. Opinions expressed herein are solely those of O’Shaughnessy Asset Management, LLC and may differ from those of your broker or investment firm.
Please remember that past performance may not be indicative of future results. Different types of investments involve varying degrees of risk, and there can be no assurance that the future performance of any specific investment, investment strategy, or product (including the investments and/or investment strategies recommended or undertaken by O’Shaughnessy Asset Management, LLC), or any non-investment related content, made reference to directly or indirectly in this piece will be profitable, equal any corresponding indicated historical performance level(s), be suitable for your portfolio or individual situation, or prove successful. Due to various factors, including changing market conditions and/or applicable laws, the content may no longer be reflective of current opinions or positions. Moreover, you should not assume that any discussion or information contained in this piece serves as the receipt of, or as a substitute for, personalized investment advice from O’Shaughnessy Asset Management, LLC. Any individual account performance information reflects the reinvestment of dividends (to the extent applicable), and is net of applicable transaction fees, O’Shaughnessy Asset Management, LLC’s investment management fee (if debited directly from the account), and any other related account expenses. Account information has been compiled solely by O’Shaughnessy Asset Management, LLC, has not been independently verified, and does not reflect the impact of taxes on non-qualified accounts. In preparing this report, O’Shaughnessy Asset Management, LLC has relied upon information provided by the account custodian. Please defer to formal tax documents received from the account custodian for cost basis and tax reporting purposes. Please remember to contact O’Shaughnessy Asset Management, LLC, in writing, if there are any changes in your personal/financial situation or investment objectives for the purpose of reviewing/evaluating/revising our previous recommendations and/or services, or if you want to impose, add, or modify any reasonable restrictions to our investment advisory services. Please Note: Unless you advise, in writing, to the contrary, we will assume that there are no restrictions on our services, other than to manage the account in accordance with your designated investment objective. Please Also Note: Please compare this statement with account statements received from the account custodian. The account custodian does not verify the accuracy of the advisory fee calculation. Please advise us if you have not been receiving monthly statements from the account custodian. Historical performance results for investment indices and/or categories have been provided for general comparison purposes only, and generally do not reflect the deduction of transaction and/or custodial charges, the deduction of an investment management fee, nor the impact of taxes, the incurrence of which would have the effect of decreasing historical performance results. It should not be assumed that your account holdings correspond directly to any comparative indices. To the extent that a reader has any questions regarding the applicability of any specific issue discussed above to his/her individual situation, he/she is encouraged to consult with the professional advisor of his/her choosing. O’Shaughnessy Asset Management, LLC is neither a law firm nor a certified public accounting firm and no portion of the newsletter content should be construed as legal or accounting advice. A copy of the O’Shaughnessy Asset Management, LLC’s current written disclosure statement discussing our advisory services and fees is available upon request
The risk-free rate used in the calculation of Sortino, Sharpe, and Treynor ratios is 5%, consistently applied across time
The universe of All Stocks consists of all securities in the Chicago Research in Security Prices (CRSP) dataset or S&P Compustat Database (or other, as noted) with inflation-adjusted market capitalization greater than $200 million as of most recent year-end. The universe of Large Stocks consists of all securities in the Chicago Research in Security Prices (CRSP) dataset or S&P Compustat Database (or other, as noted) with inflation-adjusted market capitalization greater than the universe average as of most recent year-end. The stocks are equally weighted and generally rebalanced annually
Hypothetical performance results shown on the preceding pages are backtested and do not represent the performance of any account managed by OSAM, but were achieved by means of the retroactive application of each of the previously referenced models, certain aspects of which may have been designed with the benefit of hindsight
The hypothetical backtested performance does not represent the results of actual trading using client assets nor decision-making during the period and does not and is not intended to indicate the past performance or future performance of any account or investment strategy managed by OSAM. If actual accounts had been managed throughout the period, ongoing research might have resulted in changes to the strategy which might have altered returns. The performance of any account or investment strategy managed by OSAM will differ from the hypothetical backtested performance results for each factor shown herein for a number of reasons, including without limitation the following:
- Although OSAM may consider from time to time one or more of the factors noted herein in managing any account, it may not consider all or any of such factors. OSAM may (and will) from time to time consider factors in addition to those noted herein in managing any account.
- OSAM may rebalance an account more frequently or less frequently than annually and at times other than presented herein.
- OSAM may from time to time manage an account by using non-quantitative, subjective investment management methodologies in conjunction with the application of factors.
- The hypothetical backtested performance results assume full investment, whereas an account managed by OSAM may have a positive cash position upon rebalance. Had the hypothetical backtested performance results included a positive cash position, the results would have been different and generally would have been lower.
- The hypothetical backtested performance results for each factor do not reflect any transaction costs of buying and selling securities, investment management fees (including without limitation management fees and performance fees), custody and other costs, or taxes – all of which would be incurred by an investor in any account managed by OSAM. If such costs and fees were reflected, the hypothetical backtested performance results would be lower.
- The hypothetical performance does not reflect the reinvestment of dividends and distributions therefrom, interest, capital gains and withholding taxes.
- Accounts managed by OSAM are subject to additions and redemptions of assets under management, which may positively or negatively affect performance depending generally upon the timing of such events in relation to the market’s direction.
- Simulated returns may be dependent on the market and economic conditions that existed during the period. Future market or economic conditions can adversely affect the returns.
Please Note: Socially Responsible Investing Limitations. Socially Responsible Investing involves the incorporation of Environmental, Social and Governance considerations into the investment due diligence process (“ESG). There are potential limitations associated with allocating a portion of an investment portfolio in ESG securities (i.e., securities that have a mandate to avoid, when possible, investments in such products as alcohol, tobacco, firearms, oil drilling, gambling, etc.). The number of these securities may be limited when compared to those that do not maintain such a mandate. ESG securities could underperform broad market indices. Investors must accept these limitations, including potential for underperformance. Correspondingly, the number of ESG mutual funds and exchange traded funds are few when compared to those that do not maintain such a mandate. As with any type of investment (including any investment and/or investment strategies recommended and/or undertaken by OSAM), there can be no assurance that investment in ESG securities or funds will be profitable, or prove successful.


