Purgatory for Pessimists: An Unemotional, Factor-Based Approach to International Equities
By Ehren Stanhope
December 2017
The current bull market has been unkind to non-U.S. allocations. At a conference I recently attended, the term “TINA” (There Is No Alternative) came up more than once in the context of allocating investor portfolios. It captures the collective sentiment that equities, despite a massive bull run and rising valuations, are one of few viable asset classes to park capital. Expected returns on fixed income are likely to be low and identifying top quartile alternative managers—let alone gaining access to them—is increasingly difficult.
This conundrum is further exacerbated by the dramatic outperformance of U.S. stocks on the global equity stage, captured in the table below. International and Emerging Markets have lagged their U.S. counterparts by over 5% annualized for the trailing 10-years. To put that return gap in perspective, the current balance of $1M invested in International and Emerging Markets 10 years ago would be worth about half of a similar investment in the U.S., or $1.1 million less.
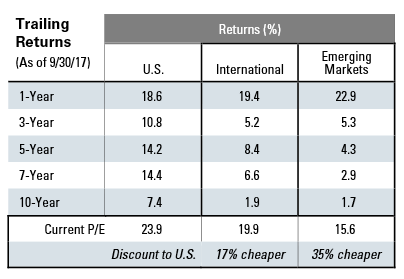
Of course, the persistent rise has lifted U.S. valuations. No matter what metric you look at (earnings, sales, cash flow, book value) or the time frame (cyclically-adjusted, trailing 12-months, normalized) the U.S. is now more expensive than it was a few years ago. While value is not a good timing metric, it’s hard to ignore valuations that are 17% cheaper for International and 35% cheaper for Emerging Markets.
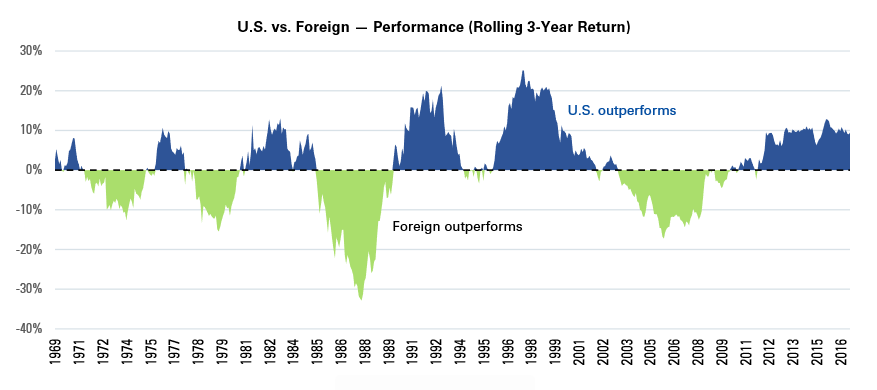
Though 10 years can seem like an eternity for investors, it’s actually only about one full market cycle. Expanding our window into returns for U.S. and non-U.S. markets back to 1970 reveals a regular cyclical pattern of leadership, as shown below in the chart of rolling 3-year performance. The current market environment represents the fifth “round trip” cycle over the past 4½ decades.
One allocation approach would be to simply buy the respective index ETFs for International and Emerging Markets and call it a day. While market level valuation metrics can be useful as a first pass, they tend to obfuscate risk and reward within broad averages. Explanations abound as to why non-U.S. stocks have lagged—from central bank intervention to economic growth to geopolitical crises. I tend to think of non-U.S. markets as “Purgatory for Pessimists” because there is always something of justifiable concern. Because we are hard-wired to form simple heuristics for efficient decision making, the line of thinking will go something like this: crisis in Greece, Greece in Europe, European crisis, Europe outside U.S., foreign = unsafe. Rinse and repeat for Russia, Abenomics, North Korean hostilities, and China’s ascendancy. A simple indexing approach to these markets naively manages these “risks” by obfuscating them within average index returns.
DIGGING BEYOND MARKET CAP TO IDENTIFY OPPORTUNITY
The return and valuation metrics presented (see table, page 1) are all based on common market cap-weighted indexes that cover hundreds, if not thousands, of stocks across their respective market. They tend to favor larger capitalization firms, thus omitting at the worst and underweighting at the least, a large portion of the global opportunity set. As believers that a stock’s characteristic profile predisposes its future performance, we often look at factor spreads for evidence of opportunity to generate excess return.
We have found that six themes collectively define the factor profile of a stock—regardless of geography, market cap, or style. Three of the themes are used specifically to select stocks: Value, Momentum, and Shareholder Yield. We assess value through the lens of multiple underlying factors—sales, cash flows, and earnings. Our Momentum theme seeks stocks with strong appreciation over the prior 3, 6, and 9 months, while avoiding those that are highly volatile. Shareholder Yield represents a total return of capital to shareholders through dividends and share buybacks. The three remaining themes are useful for eliminating stocks from consideration that fail on certain quality tests: Earnings Quality, Financial Strength, and Earnings Growth. Earnings Quality evaluates the use of accruals to boost earnings. Financial Strength assesses a company’s reliance on outside sources of capital to support its balance sheet. Earnings Growth helps to avoid unprofitable firms.
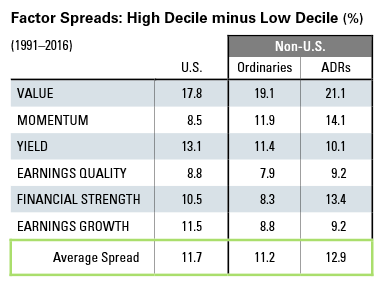
The table on this page shows the return differential between the highest-ranked and lowest-ranked decile of these six factor themes from 1991–2016.1 We look at the spreads within three universes: U.S. stocks, International Ordinary Shares, and American Depository Receipts (ADRs, which are traded like stocks in the U.S. but provide exposure to foreign companies).
While factor investing is commonly applied to U.S. stocks, the table above demonstrates that stock selection based on factors can be as effective, if not more so, outside the U.S. market. For example, the spread in return between the cheapest and most expensive U.S. stocks is 17.8% over the 26-year period. For Ordinaries, the Value spread widens to 19.1%, and for ADRs it’s even wider (21.1%). We present ADRs alongside Ordinaries to show that these uniquely structured securities provide an enticing alternative to the operational complexity and cost structure of local share portfolios without degradation in factor returns.
The key takeaway from the factor spreads shown above is that tremendous performance differentiation underlies average returns for broad groups of stocks. Wider spreads generally suggest a larger opportunity to harvest excess return through a disciplined factor-based approach. Just as a pure indexing approach neglects managing seemingly obvious risks, it also naively turns a blind eye to large, consistent, and persistent structural trends that offer the opportunity to generate alpha.
HARNESSING FACTORS TO CREATE DIFFERENTIATED INTERNATIONAL PORTFOLIOS
Select the ‘Right’ Stocks, Avoid the ‘Wrong’ Stocks
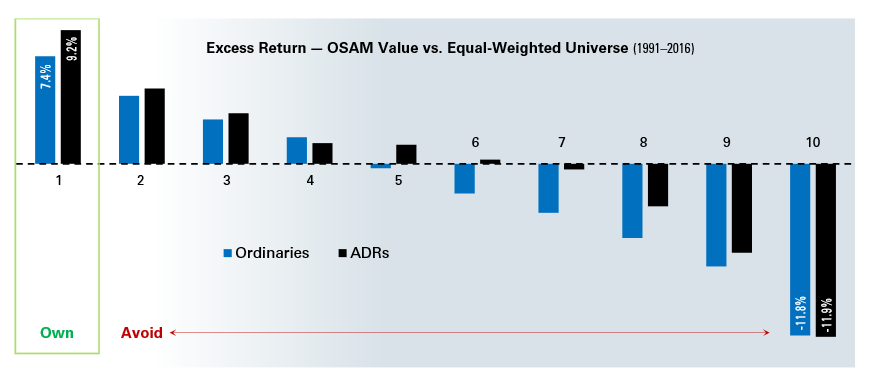
Underlying the factor spreads for Ordinaries and ADRs is a relatively consistent stair-step monotonic trend. As you move from highest-ranked to lowest-ranked stocks on each factor, there is a relatively linear degradation in excess returns. To demonstrate, we take the Ordinary and ADR universes, rank them on our Value theme, and then organize them into decile portfolios from least to most expensive. The chart below shows the annualized excess return on those decile portfolios (from cheapest decile on the left to most expensive on the right). We compare these portfolios to an equal-weighted universe of stocks that meet certain liquidity and market cap criteria.2 In other words, we do not begin our assessment from the point of view of a cap-weighted benchmark. Clearly, investors ought to own more of the cheap stocks and fewer of the expensive ones. We’ve found similar results with our other two key stock selection themes: Momentum and Shareholder Yield.
Cap-weighted indexes are agnostic to this empirical evidence. Astute investors would seek to concentrate into the highest-ranked deciles and avoid stocks in the lowest-ranked deciles to enhance portfolio return. There are a couple of ways to do this in practice. One method is to tilt towards cheap stocks, owning a little more of them, and a little less of the expensive stocks, than the cap-weighted index. This is the "smart beta" approach—great for large institutional investors who are more mindful of Tracking Error and care more about Information Ratios than absolute returns. A second approach, which I’ll explore next, is to simply own the highest-ranked stocks, while avoiding the rest of the universe.
Incorporate Multiple Factors for Consistency & Diversification
Value by itself is a powerful factor. However, incorporating Momentum and Shareholder Yield provides benefits to risk-adjusted return and consistency. The table on the next page includes the results from 1991–2016 of a
hypothetical multi-factor ADR portfolio built by eliminating stocks that rank poorly on our Earnings Quality, Financial Strength, and Earnings Growth themes, then by selecting names that fall into the highest-ranking deciles on our Value, Momentum, and Shareholder Yield themes.
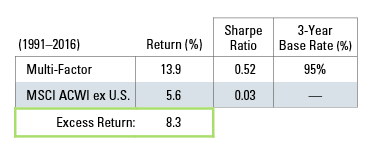
This multi-factor ADR portfolio outperforms the MSCI ACWI ex U.S. by 8.3% annualized over the period with a dramatically higher Sharpe Ratio. Importantly, the multi-factor portfolio’s performance is consistent. We measure consistency with Base Rates, which are batting averages for how often a strategy beats its benchmark in rolling periods. In this case, the multi-factor portfolio outperforms the benchmark 95% of the time in rolling 3-year periods.
Concentrate & Weight by Conviction — not Market Cap
Inherent in owning only the highest-ranked names by a given factor is accepting that large portions of the eligible universe will go un-owned. This introduces significant differentiation into a portfolio in terms of Active Share, but also higher Tracking Error.3 Given the information above on Value, we should certainly be comfortable not owning the underperforming deciles and accepting the Tracking Error that results.
To evaluate the importance of concentration, we ran portfolios ranging from 5 to 300 stocks and, as the number of names within the portfolio expanded, we charted the excess return relative to the MSCI ACWI ex U.S. We constructed two versions of the concentrated portfolios to show the deleterious impact of market capweighting when introduced.
The equal-weighted version simply ranks all stocks in the universe on our Value theme and then equalweights the cheapest names. The cap-weighted version selects the exact same names, but weights them in the portfolio proportionate to their market caps.
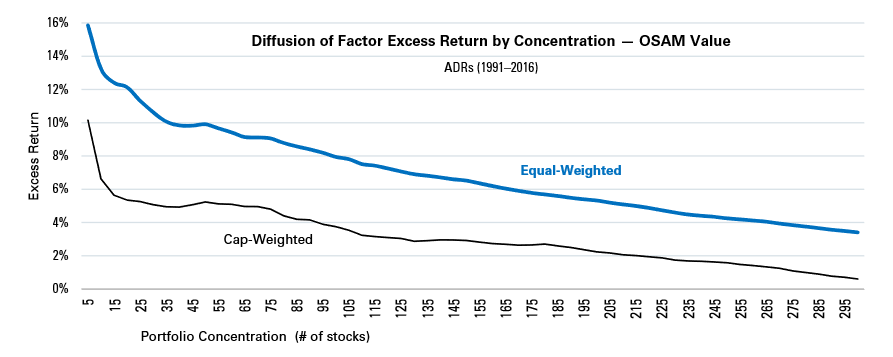
In both cases, the degradation of excess return is apparent as the number of names allowed in the portfolio expands. Also, notice the disparity in excess return between an equal-weighted versus a cap-weighted portfolio construction process. These are the exact same stocks! Yet, a cap-weighted approach underperforms by hundreds of basis points, even in large 300-stock portfolios.
There are No Free Lunches, Embrace Lower Capacity
All of this looks great on paper. The challenge is in effective implementation. As concentration increases, strategy capacity decreases. And, as the tie to market cap weighting is severed, capacity decreases and implementation costs increase.
Fortunately for U.S. domiciled investors, ADRs provide cost effective vehicles whose implementation costs are on par with their U.S. common stock counterparts. Below, we compare the all-in market impact cost to make trades of various sizes for U.S. common stocks, ADRs based on portfolios of 50, 100, 200, and 300 stocks at portfolio sizes from $50 million to $1 billion.
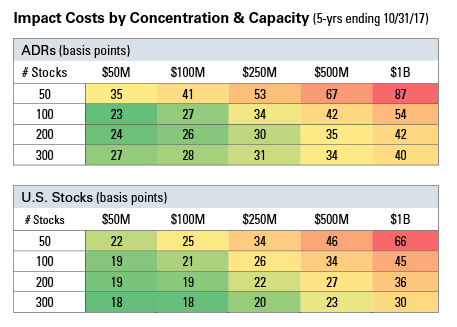
In all cases, portfolios are more expensive to trade as concentration and capacity increase, but the overall cost to trade U.S. and ADR stocks is remarkably similar—skilled traders can narrow the gap further. Impact costs increase significantly between the 50-stock and 100-stock portfolios for both regions, reinforcing that there are tangible implementation costs to balance out the benefits of concentration.
Plan Accordingly
As the U.S. bull market rages on, it is important for investors to remember that all market cycles are mean reverting. The U.S. has been the leader, but may not be in the future. In fact, 2017 has seen a reversal of the prior years’ trend. While Emerging and Developed Markets have outperformed, it remains to be seen if this trend continues. Valuations are significantly discounted outside the U.S. market. Factor spreads are equally as wide as, or wider than, historical averages, which suggests that disciplined investors have a significant opportunity to harness the power of factors to create differentiated portfolios.
For our part, we suggest a strategy that parses the international landscape to eliminate stocks which rank poorly on quality criteria and then concentrate on names with strong Value, Momentum, and Shareholder Yield. Our International ADR strategy has successfully used this methodology since inception in January 2006. A key driver of performance has been application of a consistent factor profile over time. The characteristics table below illustrates the current positioning of the portfolio.

Across valuation metrics—sales, earnings, and cash flows—the portfolio is priced at significant discounts. As well, it meets or beats the benchmark’s Quality metrics (Debt-to-Equity, 1-Year EPS Growth, and ROIC). Plus, the portfolio has stronger Momentum and higher Shareholder Yield. We believe this recipe for stock selection will continue to deliver strong results in the future.
GENERAL LEGAL DISCLOSURES & HYPOTHETICAL AND/OR BACKTESTED RESULTS DISCLAIMER
The material contained herein is intended as a general market commentary. Opinions expressed herein are solely those of O’Shaughnessy Asset Management, LLC and may differ from those of your broker or investment firm.
Please remember that past performance may not be indicative of future results. Different types of investments involve varying degrees of risk, and there can be no assurance that the future performance of any specific investment, investment strategy, or product (including the investments and/or investment strategies recommended or undertaken by O’Shaughnessy Asset Management, LLC), or any non-investment related content, made reference to directly or indirectly in this piece will be profitable, equal any corresponding indicated historical performance level(s), be suitable for your portfolio or individual situation, or prove successful. Due to various factors, including changing market conditions and/or applicable laws, the content may no longer be reflective of current opinions or positions. Moreover, you should not assume that any discussion or information contained in this piece serves as the receipt of, or as a substitute for, personalized investment advice from O’Shaughnessy Asset Management, LLC. Any individual account performance information reflects the reinvestment of dividends (to the extent applicable), and is net of applicable transaction fees, O’Shaughnessy Asset Management, LLC’s investment management fee (if debited directly from the account), and any other related account expenses. Account information has been compiled solely by O’Shaughnessy Asset Management, LLC, has not been independently verified, and does not reflect the impact of taxes on non-qualified accounts. In preparing this report, O’Shaughnessy Asset Management, LLC has relied upon information provided by the account custodian. Please defer to formal tax documents received from the account custodian for cost basis and tax reporting purposes. Please remember to contact O’Shaughnessy Asset Management, LLC, in writing, if there are any changes in your personal/financial situation or investment objectives for the purpose of reviewing/evaluating/revising our previous recommendations and/or services, or if you want to impose, add, or modify any reasonable restrictions to our investment advisory services. Please Note: Unless you advise, in writing, to the contrary, we will assume that there are no restrictions on our services, other than to manage the account in accordance with your designated investment objective. Please Also Note: Please compare this statement with account statements received from the account custodian. The account custodian does not verify the accuracy of the advisory fee calculation. Please advise us if you have not been receiving monthly statements from the account custodian. Historical performance results for investment indices and/or categories have been provided for general comparison purposes only, and generally do not reflect the deduction of transaction and/or custodial charges, the deduction of an investment management fee, nor the impact of taxes, the incurrence of which would have the effect of decreasing historical performance results. It should not be assumed that your account holdings correspond directly to any comparative indices. To the extent that a reader has any questions regarding the applicability of any specific issue discussed above to his/her individual situation, he/she is encouraged to consult with the professional advisor of his/her choosing. O’Shaughnessy Asset Management, LLC is neither a law firm nor a certified public accounting firm and no portion of the newsletter content should be construed as legal or accounting advice. A copy of the O’Shaughnessy Asset Management, LLC’s current written disclosure statement discussing our advisory services and fees is available upon request
The risk-free rate used in the calculation of Sortino, Sharpe, and Treynor ratios is 5%, consistently applied across time
The universe of All Stocks consists of all securities in the Chicago Research in Security Prices (CRSP) dataset or S&P Compustat Database (or other, as noted) with inflation-adjusted market capitalization greater than $200 million as of most recent year-end. The universe of Large Stocks consists of all securities in the Chicago Research in Security Prices (CRSP) dataset or S&P Compustat Database (or other, as noted) with inflation-adjusted market capitalization greater than the universe average as of most recent year-end. The stocks are equally weighted and generally rebalanced annually
Hypothetical performance results shown on the preceding pages are backtested and do not represent the performance of any account managed by OSAM, but were achieved by means of the retroactive application of each of the previously referenced models, certain aspects of which may have been designed with the benefit of hindsight
The hypothetical backtested performance does not represent the results of actual trading using client assets nor decision-making during the period and does not and is not intended to indicate the past performance or future performance of any account or investment strategy managed by OSAM. If actual accounts had been managed throughout the period, ongoing research might have resulted in changes to the strategy which might have altered returns. The performance of any account or investment strategy managed by OSAM will differ from the hypothetical backtested performance results for each factor shown herein for a number of reasons, including without limitation the following:
- Although OSAM may consider from time to time one or more of the factors noted herein in managing any account, it may not consider all or any of such factors. OSAM may (and will) from time to time consider factors in addition to those noted herein in managing any account.
- OSAM may rebalance an account more frequently or less frequently than annually and at times other than presented herein.
- OSAM may from time to time manage an account by using non-quantitative, subjective investment management methodologies in conjunction with the application of factors.
- The hypothetical backtested performance results assume full investment, whereas an account managed by OSAM may have a positive cash position upon rebalance. Had the hypothetical backtested performance results included a positive cash position, the results would have been different and generally would have been lower.
- The hypothetical backtested performance results for each factor do not reflect any transaction costs of buying and selling securities, investment management fees (including without limitation management fees and performance fees), custody and other costs, or taxes – all of which would be incurred by an investor in any account managed by OSAM. If such costs and fees were reflected, the hypothetical backtested performance results would be lower.
- The hypothetical performance does not reflect the reinvestment of dividends and distributions therefrom, interest, capital gains and withholding taxes.
- Accounts managed by OSAM are subject to additions and redemptions of assets under management, which may positively or negatively affect performance depending generally upon the timing of such events in relation to the market’s direction.
- Simulated returns may be dependent on the market and economic conditions that existed during the period. Future market or economic conditions can adversely affect the returns.


