Peculiar Stock Leadership in 2016
By OSAM Research Team
July 2016
Bank of America started tracking the performance of active managers in 2003, and 2016 has—thus far—been the most difficult year on record for active managers: only 18 percent of large cap managers have outperformed the Russell 1000® through June 30.1 The Russell 1000 Value has beaten the Russell 1000 Growth, but the companies with the highest returns this year have had a peculiar profile. The top-performing names in the Russell 1000 Value make up more than half the return, but on average they are not cheap and have negative growth. You don’t see many pitchbooks that say “We buy stagnating or low growth businesses trading at average prices”—but that is the profile of the stocks which have led the market in 2016. Let’s explore.
Most Value Factors are Underperforming Price-to-Book: Russell’s Definition of Value
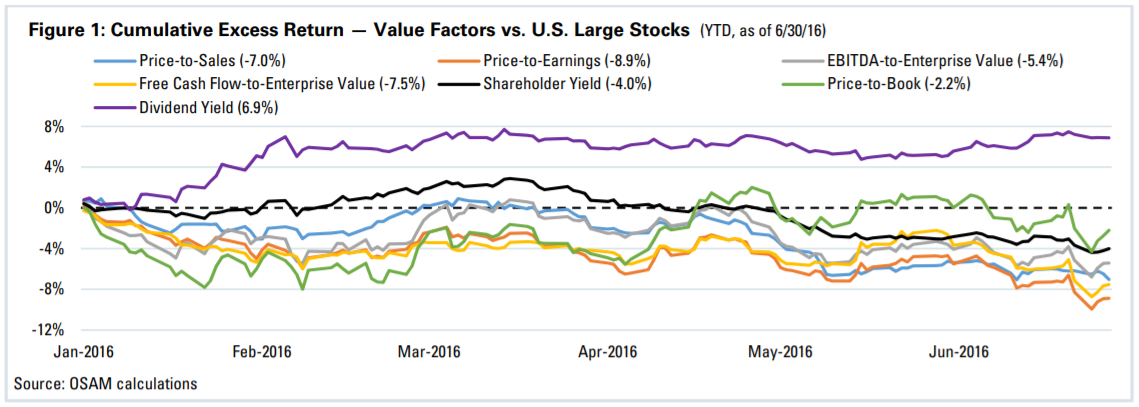
Figure 1 below shows the year-to-date cumulative excess return for various value factors (measured by the performance of the highest decile for each factor) versus an equal-weighted U.S. Large Stocks benchmark.2 Every factor except dividend yield is negative and price-to-book is beating all other factors. Any active manager with a focus on cheap valuation (based on something other than dividend yield) is likely seeing that focus detract from performance. Dividend managers likely represent a large portion of those 18 percent of managers that are outperforming. Further, price-to-book is Russell’s key valuation-based factor when building the style indices—so a manager using one of the other factors will have a hard time keeping up with Russell’s value benchmark.
Our preferred definition of Value uses a combined measure, incorporating price-to-sales, price-to-earnings, free cash flow-to-enterprise value, EBITDA-to-enterprise value, and shareholder yield. As shown in Figure 2 (below), the gap between the performance of this multi-factor value composite and the single-factor price-to-book is six percent year to date. This is a significant gap and a very uncommon one.

The histogram below (Figure 3) shows just how uncommon this gap is; in only six percent of all rolling six-month observations on record have we seen a gap this large.3 Since 1963, our Value composite has outperformed price-to-book in 57 percent of six-month rolling periods and in over 70 percent of rolling one-year periods.

Low-Growth Companies are Driving the Outperformance of Value Indices
Year to date, the Russell 1000 Value is beating the Russell 1000 Growth by a margin of almost five percent.4 But as we saw above, most measures of “value” are doing poorly so far this year, so why the large gap between Russell’s value and growth indexes?
The answer lies in how Russell defines value versus growth. Russell uses a ranking formula which is 50 percent value (price-to-book) and 50 percent growth (EPS growth and 5-year sales growth) to decide where each stock falls on the value/growth spectrum. Anything cheap and/or with horrible growth is considered value and anything with great growth and/or that is extremely expensive is considered growth. This methodology creates a dynamic where a portion of the Russell Value index actually includes slightly expensive stocks that have very bad trailing sales growth and expected EPS growth. Likewise, a portion of the growth index will include stocks with below average or negative growth but defined as growth due to their extremely expensive valuations.
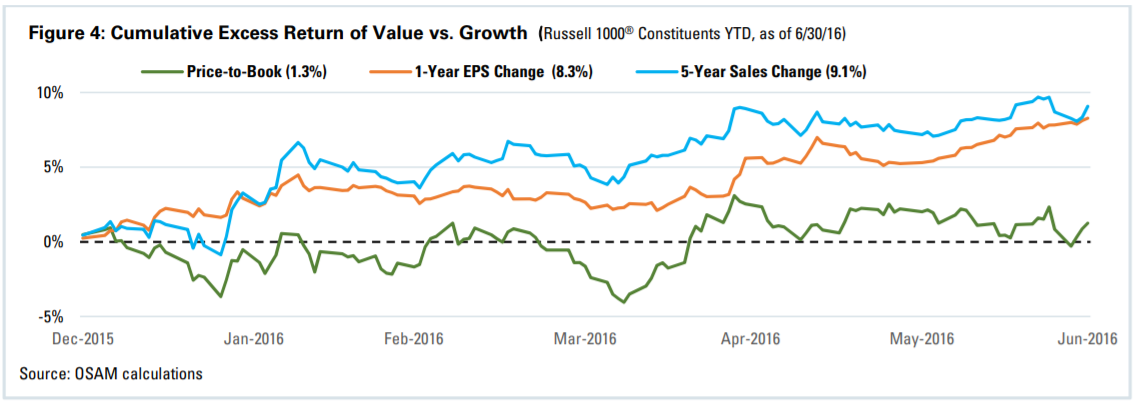
In rare occasions, these little talked about groups of stocks can drive performance of the style indices, which is exactly what we are seeing this year in the Russell 1000 Value. Figure 4 (below) shows the excess return of value versus growth for each of the factors used in Russell’s methodology. Whereas we used decile portfolios to highlight different value factors above, we now tailor the analysis to more closely match Russell’s method (which carves the market into thirds). We start with the constituents of the Russell 1000 and calculate the return difference between the top third and bottom third by each factor. For example, the return of +1.3 percent for price-to-book is the result of:
- Ranking the cheapest third of stocks by price-to-book in the Russell 1000 to build our portfolio,
- Calculating the return (weighted by market capitalization) of that portfolio for the year,
- Doing the same for the most expensive third, and
- Subtracting one from the other.
You can see that, while the cheapest third of stocks by price-to-book has outperformed the most expensive third within the Russell 1000, the difference is relatively small. The real story is the outperformance of low growth over high growth. Companies with the lowest sales and earnings growth have outperformed those with the highest growth by eight to nine percent so far this year. The gap of value versus growth indices is more a surge in stocks with terrible sales and earnings growth and less a triumph of traditional cheap over expensive.
Any active manager seeking to avoid companies with dismal growth will also avoid the companies driving returns in the benchmark.
Top 10 Contributors in Russell 1000 Value are not Cheap and have Negative Growth
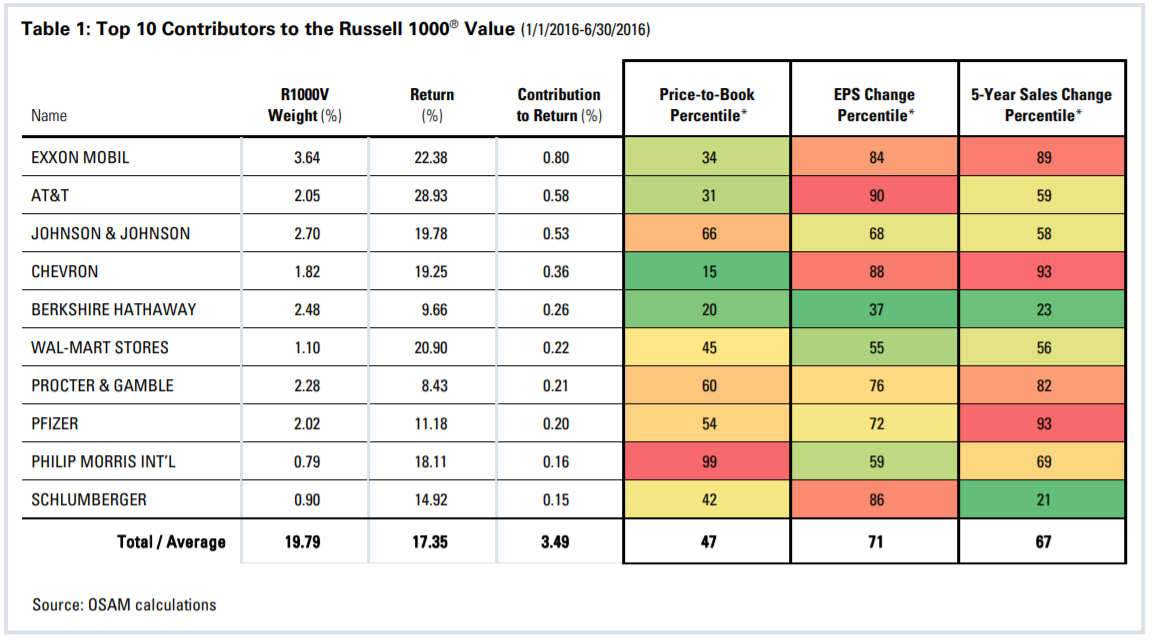
This becomes even more apparent when you look at the profile of the top performers in the Russell 1000 Value Index. The 10 names in the table below—the top contributors to the benchmark return—make up 20 percent of the bench-mark and contributed 3.5 percent to the benchmark’s return of 6.3 percent; over half of the year to date return.
For each stock in Table 1, we show the percentile rank at the start of the year within the Russell 1000 of the price-to-book ratio, EPS growth, and five-year sales growth numbers (where 1 would be the cheapest/highest growth percentile and 100 the most expensive/lowest growth). Only three of the 10 stocks are even in the cheapest third of U.S. companies by price-to-book and the average is just under the median. Further, nine of the 10 names had negative earnings growth (i.e., shrinking earnings) to start the year and more than half had shrinking sales numbers. The average of these 10 names had earnings that shrunk -27.5 percent over the last year, a reduction in total sales of -8.5 percent over the last five years and they were only slightly less expensive than the market median. Names with similar characteristics—negative earnings growth companies near the median by price-to-book—underperform the market 65 percent of the time.5
Using Russell style benchmarks to build a market narrative makes sense: they are widely-followed benchmarks. But, so far this year, the returns of value versus growth are misleading. Cheap is not beating expensive, on average, but low growth is crushing strong growth. Over the longer term, a strong strategy is to be long cheap stocks—not long low growth businesses. But being long cheap stocks has thus far failed in 2016.
Footnotes:
1 Source: Bank of America Merrill Lynch U.S. Equity and Quant Research. They began tracking performance of active managers in 2003.
2 Defined as all publicly traded U.S. companies that have market caps greater than average, excluding ADRs.
3 All rolling periods from 1963 to 2015, using all investable U.S. Large Stocks in the COMPUSTAT database.
4 From 1/1/2016 to 6/30/2016 the Russell 1000 Value returned 6.3 percent while the Russell 1000 Growth is up 1.35 percent.
5 Measured using a portfolio of every stock that ranks in the middle one third of the Large Stocks Universe by price-to-book and also has negative earnings growth. The annualized return of this portfolio was lower than the equally weighted large stocks portfolio in 65% of all rolling 12 month period from 1964-2015.
General Legal Disclosures & Hypothetical and/or Backtested Results Disclaimer
The material contained herein is intended as a general market commentary. Opinions expressed herein are solely those of O’Shaughnessy Asset Management, LLC and may differ from those of your broker or investment firm.
Please remember that past performance may not be indicative of future results. Different types of investments involve varying degrees of risk, and there can be no assurance that the future performance of any specific investment, investment strategy, or product (including the investments and/or investment strategies recommended or undertaken by O’Shaughnessy Asset Management, LLC), or any non-investment related content, made reference to directly or indirectly in this piece will be profitable, equal any corresponding indicated historical performance level(s), be suitable for your portfolio or individual situation, or prove successful. Due to various factors, including changing market conditions and/or applicable laws, the content may no longer be reflective of current opinions or positions. Moreover, you should not assume that any discussion or information contained in this piece serves as the receipt of, or as a substitute for, personalized investment advice from O’Shaughnessy Asset Management, LLC. Any individual account performance information reflects the reinvestment of dividends (to the extent applicable), and is net of applicable transaction fees, O’Shaughnessy Asset Management, LLC’s investment management fee (if debited directly from the account), and any other related account expenses. Account information has been compiled solely by O’Shaughnessy Asset Management, LLC, has not been independently verified, and does not reflect the impact of taxes on non-qualified accounts. In preparing this report, O’Shaughnessy Asset Management, LLC has relied upon information provided by the account custodian. Please defer to formal tax documents received from the account custodian for cost basis and tax reporting purposes. Please remember to contact O’Shaughnessy Asset Management, LLC, in writing, if there are any changes in your personal/financial situation or investment objectives for the purpose of reviewing/evaluating/revising our previous recommendations and/or services, or if you want to impose, add, or modify any reasonable restrictions to our investment advisory services. Please Note: Unless you advise, in writing, to the contrary, we will assume that there are no restrictions on our services, other than to manage the account in accordance with your designated investment objective. Please Also Note: Please compare this statement with account statements received from the account custodian. The account custodian does not verify the accuracy of the advisory fee calculation. Please advise us if you have not been receiving monthly statements from the account custodian. Historical performance results for investment indices and/or categories have been provided for general comparison purposes only, and generally do not reflect the deduction of transaction and/or custodial charges, the deduction of an investment management fee, nor the impact of taxes, the incurrence of which would have the effect of decreasing historical performance results. It should not be assumed that your account holdings correspond directly to any comparative indices. To the extent that a reader has any questions regarding the applicability of any specific issue discussed above to his/her individual situation, he/she is encouraged to consult with the professional advisor of his/her choosing. O’Shaughnessy Asset Management, LLC is neither a law firm nor a certified public accounting firm and no portion of the newsletter content should be construed as legal or accounting advice. A copy of the O’Shaughnessy Asset Management, LLC’s current written disclosure statement discussing our advisory services and fees is available upon request.
The risk-free rate used in the calculation of Sortino, Sharpe, and Treynor ratios is 5%, consistently applied across time.
The universe of All Stocks consists of all securities in the Chicago Research in Security Prices (CRSP) dataset or S&P Compustat Database (or other, as noted) with inflation-adjusted market capitalization greater than $200 million as of most recent year-end. The universe of Large Stocks consists of all securities in the Chicago Research in Security Prices (CRSP) dataset or S&P Compustat Database (or other, as noted) with inflation-adjusted market capitalization greater than the universe average as of most recent year-end. The stocks are equally weighted and generally rebalanced annually.
Hypothetical performance results shown on the preceding pages are backtested and do not represent the performance of any account managed by OSAM, but were achieved by means of the retroactive application of each of the previously referenced models, certain aspects of which may have been designed with the benefit of hindsight.
The hypothetical backtested performance does not represent the results of actual trading using client assets nor decision-making during the period and does not and is not intended to indicate the past performance or future performance of any account or investment strategy managed by OSAM. If actual accounts had been managed throughout the period, ongoing research might have resulted in changes to the strategy which might have altered returns. The performance of any account or investment strategy managed by OSAM will differ from the hypothetical backtested performance results for each factor shown herein for a number of reasons, including without limitation the following:
- Although OSAM may consider from time to time one or more of the factors noted herein in managing any account, it may not consider all or any of such factors. OSAM may (and will) from time to time consider factors in addition to those noted herein in managing any account.
- OSAM may rebalance an account more frequently or less frequently than annually and at times other than presented herein.
- OSAM may from time to time manage an account by using non-quantitative, subjective investment management methodologies in conjunction with the application of factors.
- The hypothetical backtested performance results assume full investment, whereas an account managed by OSAM may have a positive cash position upon rebalance. Had the hypothetical backtested performance results included a positive cash position, the results would have been different and generally would have been lower.
- The hypothetical backtested performance results for each factor do not reflect any transaction costs of buying and selling securities, investment management fees (including without limitation management fees and performance fees), custody and other costs, or taxes – all of which would be incurred by an investor in any account managed by OSAM. If such costs and fees were reflected, the hypothetical backtested performance results would be lower.
- The hypothetical performance does not reflect the reinvestment of dividends and distributions therefrom, interest, capital gains and withholding taxes.
- Accounts managed by OSAM are subject to additions and redemptions of assets under management, which may positively or negatively affect performance depending generally upon the timing of such events in relation to the market’s direction.
- Simulated returns may be dependent on the market and economic conditions that existed during the period. Future market or economic conditions can adversely affect the returns.
1] Defined as all publicly traded U.S. companies that have market caps greater h. They began tracking performance of active managers in 2003.


