Paradigm Shifts: Commodification to Personalization
By Jamie Catherwood
March 2022
Humans don’t like change. We love innovation, but not change. This seemingly irrational paradox stems from a powerful concept in psychology: inertia.
“Inertia is the tendency of consumers to adhere to their existing habits or actions even when presented with a superior alternative.”1
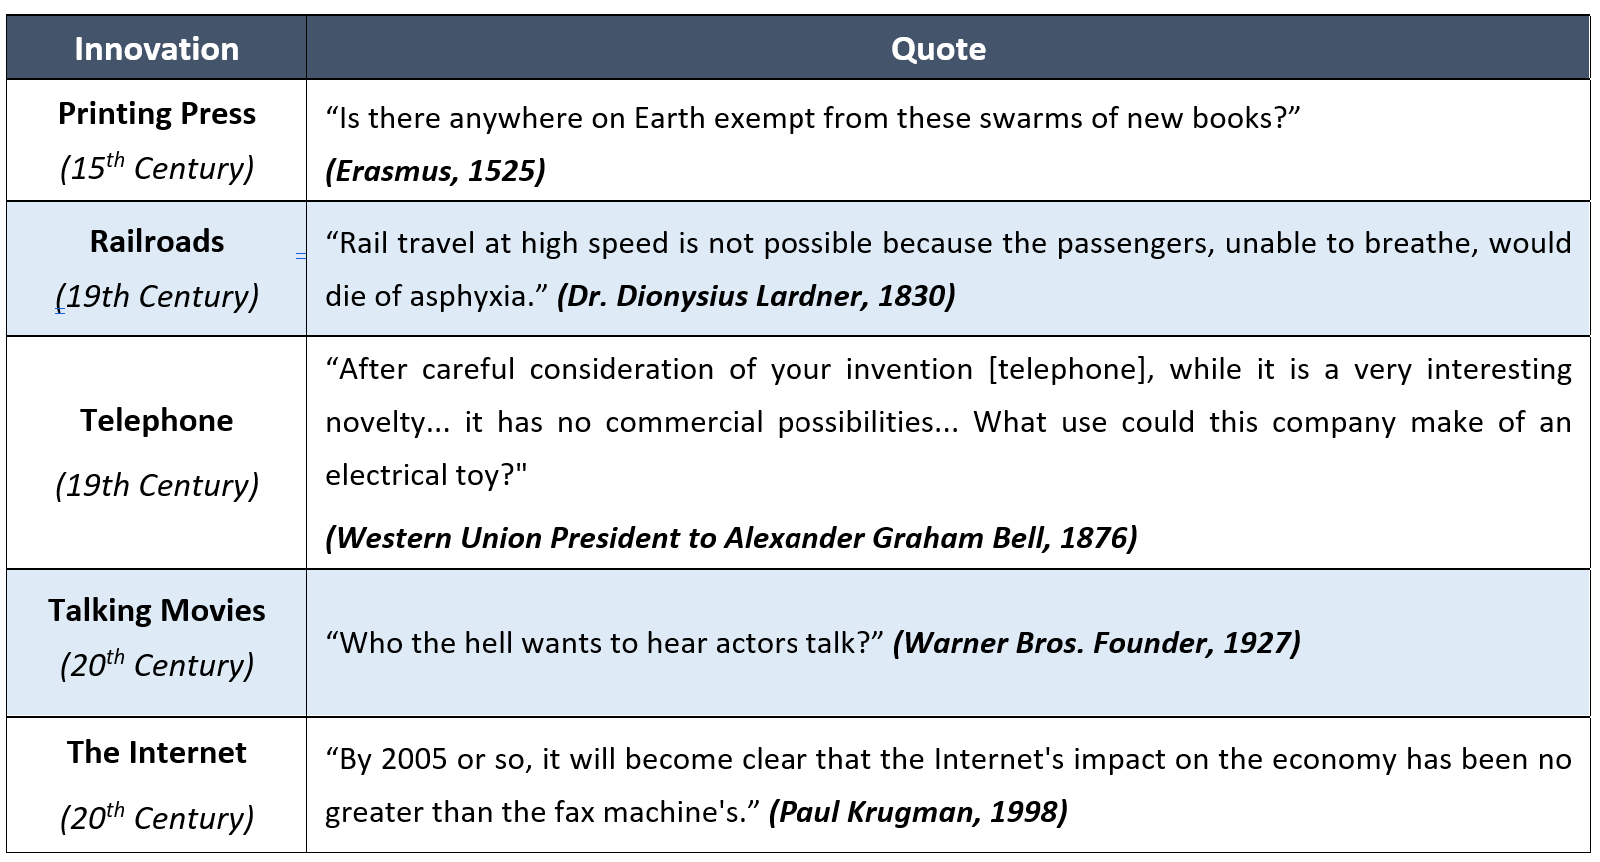
Although we often inevitably switch to the better alternative, we initially search for reasons to avoid changing the status quo. Some of history’s greatest innovations were originally ridiculed and resisted:
The finance industry is no exception. There is roughly $11 trillion invested in U.S. equity index funds today, but when they first launched, index funds were deemed “un-American”.2
Exchange-traded funds (ETFs) faced a similar reception when they first launched in the 1990s. Despite their advantages over costlier and less tax efficient mutual funds, investors resisted this new product challenging the status quo. Of course, we now know that investors ultimately recognized the merits of ETFs over mutual funds, and the asset flows for each vehicle have reflected that shift in sentiment.
In many cases, technology is the antidote for inertia as it solves the problems creating inertia. This was true for ETFs, which benefitted from advances in telecommunications technology during the 1990s as transmitting data and stock prices became cheaper. Then, a combination of the internet and cheaper technology facilitated the rise of online brokerage firms allowing retail investors to buy ETFs.
Today we are on the precipice of another technology-led evolution in asset management: a transition from the commodification represented by mass-market ETFs to the personalization possible with Custom Indexing.
THE CUSTOM INDEX
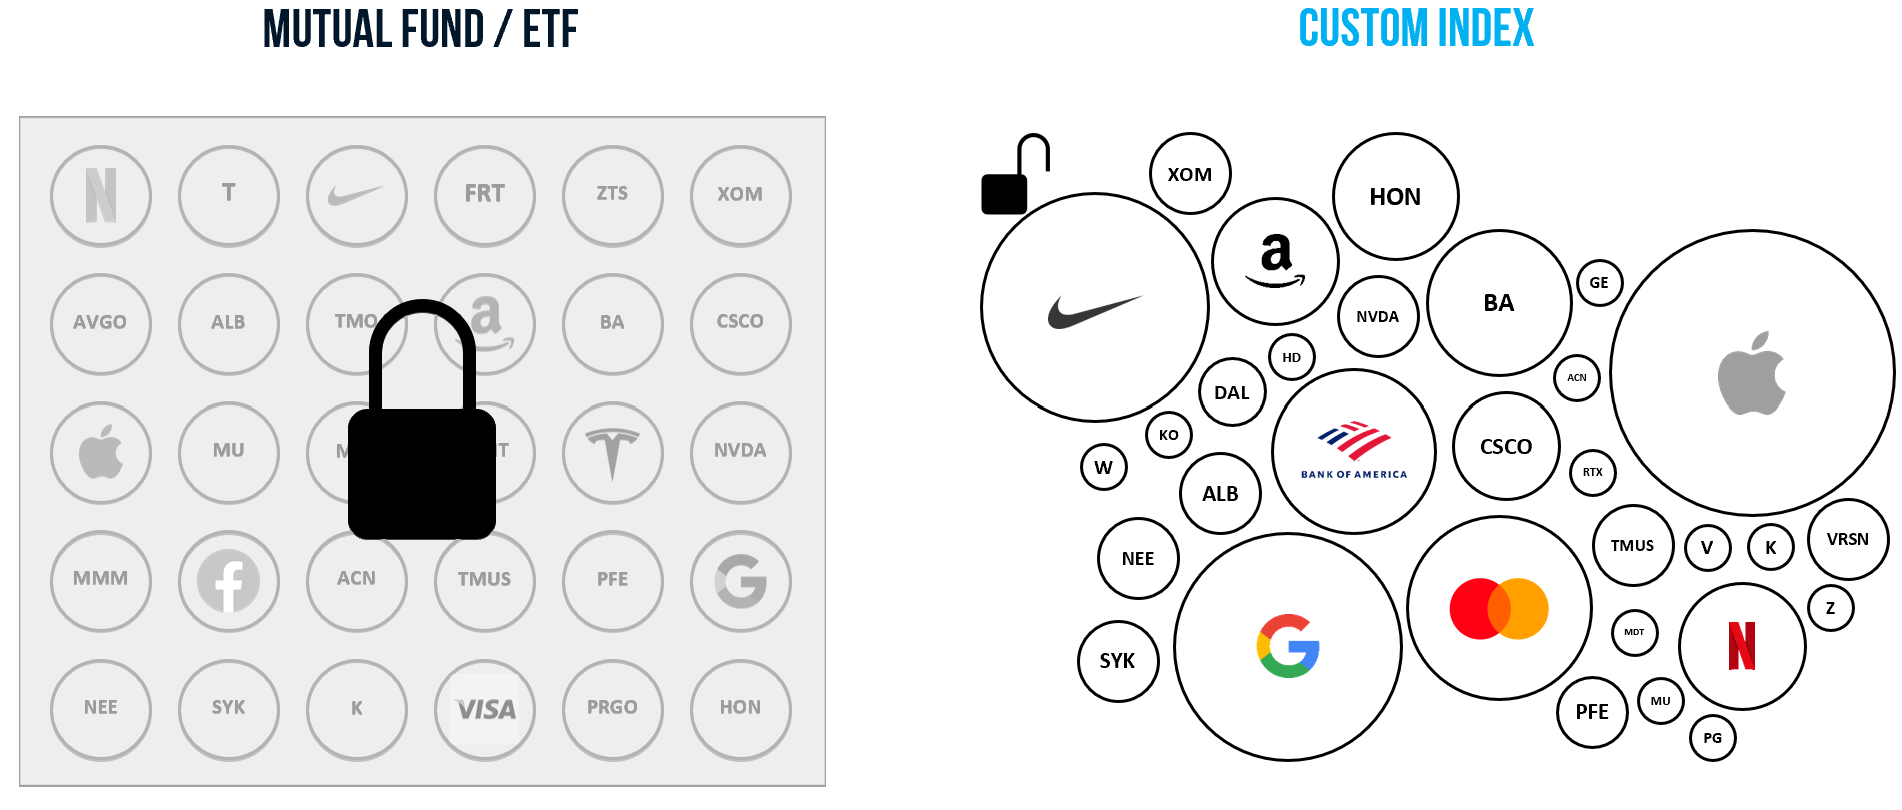
The innovation of ETFs was leveraging technology to bundle a diversified basket of stocks into a low-cost, liquid and exchange-traded vehicle. Today, the Custom Index leverages new technology and developments like commission-free trading to unbundle pre-packaged funds (ETFs) into a truly personalized, inexpensive, tax efficient vehicle.
Custom Indexes are implemented through a separately managed account (SMA) where investors directly own a mix of individual securities instead of indirectly owning positions through shares of funds and ETFs.
Owning individual securities in a Custom Index enables more precise execution of high-end financial planning and benefits not available to ETFs, particularly in tax loss harvesting, ESG & SRI, concentrated stock risk management, transitioning of securities, and Customization.
DIMENSIONS OF COMPARISON
Proponents of ETFs could argue “if it ain’t broke, don’t fix it.” ETFs certainly remain a fantastic way to invest and are a great option for many investors. However, just because your Motorola Razr still works, it doesn’t mean you shouldn’t get an iPhone.
Still, as with any product challenging the status quo, the onus is on Custom Index providers to demonstrate their advantage over ETFs. This article focuses on how Custom Indexing can surpass ETFs in each of the broad categories we feel advisors value most: Cost, Taxes, Scalability, and Customization.
COST
Arguably the most defining feature of ETFs is their low cost. With expense ratios on some passive ETFs falling below 0.05%, ETFs have a seemingly clear advantage over Custom Indexes. The truth, however, is more nuanced.
"Cheap" can be Expensive
ETFs are powerful in simplicity, but their low cost reflects that simplicity. If “you pay for what you get”, ETFs give you “cheap, simple, and reliable”. This is not a sleight against ETFs but it is relevant because of their hidden costs.
The issue with ETFs and commingled funds is that their structure prevents advisors from accessing other tools to better serve clients. Before discussing these tools, however, we should acknowledge the apples-oranges comparison many make when comparing the costs of ETFs to other vehicles. People often use passive low-cost US Large Cap funds priced at 0.03% as the benchmark as if this fee applies to all ETFs. This ignores the reality that advisors use a blend of active and passive funds across a range of investment universes that are substantially higher than 0.03%.
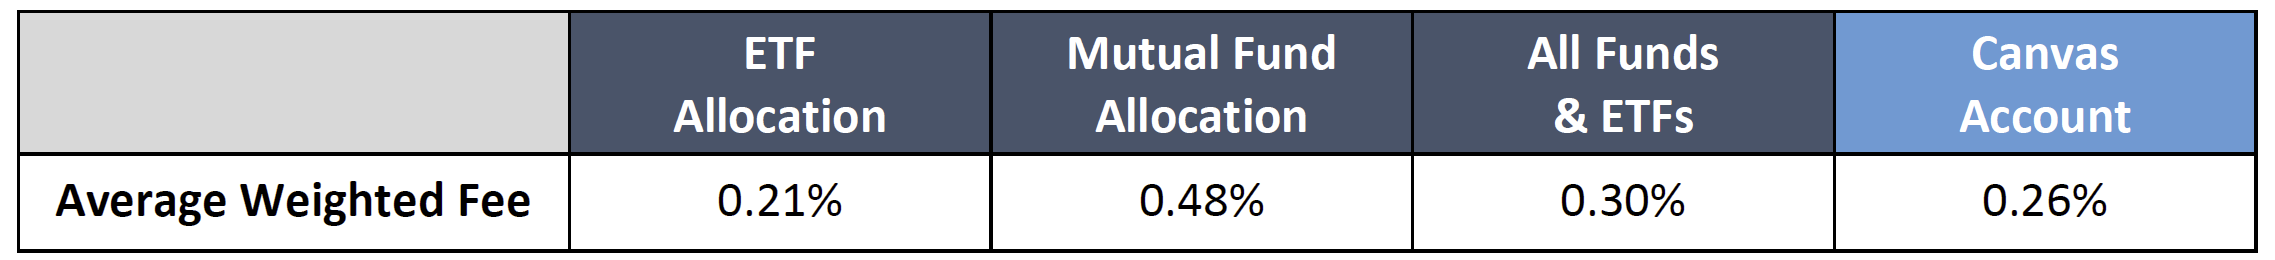
Unfortunately, there is no clean data set available on advisors’ most common ETF allocations and their associated expense ratios. However, one of the differentiating features of Canvas (OSAM’s Custom Indexing platform) is its “Transition Tool”, which allows advisors to construct a “road map” for transitioning clients’ existing portfolios onto Canvas.
Since the portfolios uploaded are managed by advisors pre-Canvas, we analyzed this data as a proxy for the allocations and funds commonly used by advisors. As expected, the weighted ETF allocation fees were more representative of the true fees paid on an entire allocation of ETFs, as opposed to the fee on one passive US Large Cap ETF.
As we alluded to, ETFs have hidden costs not included in expense ratios: the capabilities you cannot access.

Viewed through this lens, the true cost of ETFs feels more expensive. The beauty of a Custom Index is that advisors can recreate their existing portfolio exposures for a comparable fee, and access powerful capabilities unavailable in ETFs at no additional cost. For example, using a Custom Indexing platform, an advisor can establish customized annual tax budgets for each one of their clients.
Canvas has a 0.20% minimum fee for accounts over $1 Million, but no added costs for the platform’s many features. Clients are not charged for beta exposure, and the management fee is simply based on factor and region exposures. A $1.5 million portfolio with 100% passive beta exposure would be charged 0.20% for use of the platform, and all capabilities offered in Canvas.
Advisors are effectively paying the same fee as a Custom Index for an ETF allocation that cannot execute opportunitstic loss harvesting, create client-specific tax budgets, customize for every client’s unique preferences at scale, or account for concentrated stock risk.
TAXES
Exchange-traded funds have gained popularity with advisors and investors because they are more tax efficient than their predecessors: mutual funds. Specifically, this advantage stems from ETFs not distributing capital gains to investors. However, an investment vehicle’s tax efficiency should be measured on an absolute basis, not relative. In other words, we all agree that ETFs are more tax efficient than mutual funds, but does that mean they are “best-in-class”?
For all their proficiencies, ETFs remain deficient in key areas. The main issue with ETFs is rooted in their commingled structure, which leaves no room for sophisticated tax management and loss harvesting on individual-securities. So, while they don’t pass through capital gains distributions, they do prohibit investors from receiving the full benefits of tax loss harvesting.
For example, since 1990, 36% of companies in the Russell 1000 Index have negative returns in a given year. Importantly, this occurs when the index has a positive or negative annual return. For example, in 2020 the Russell 1000 Index returned 20.96%, but 39% of companies in the index had negative returns.
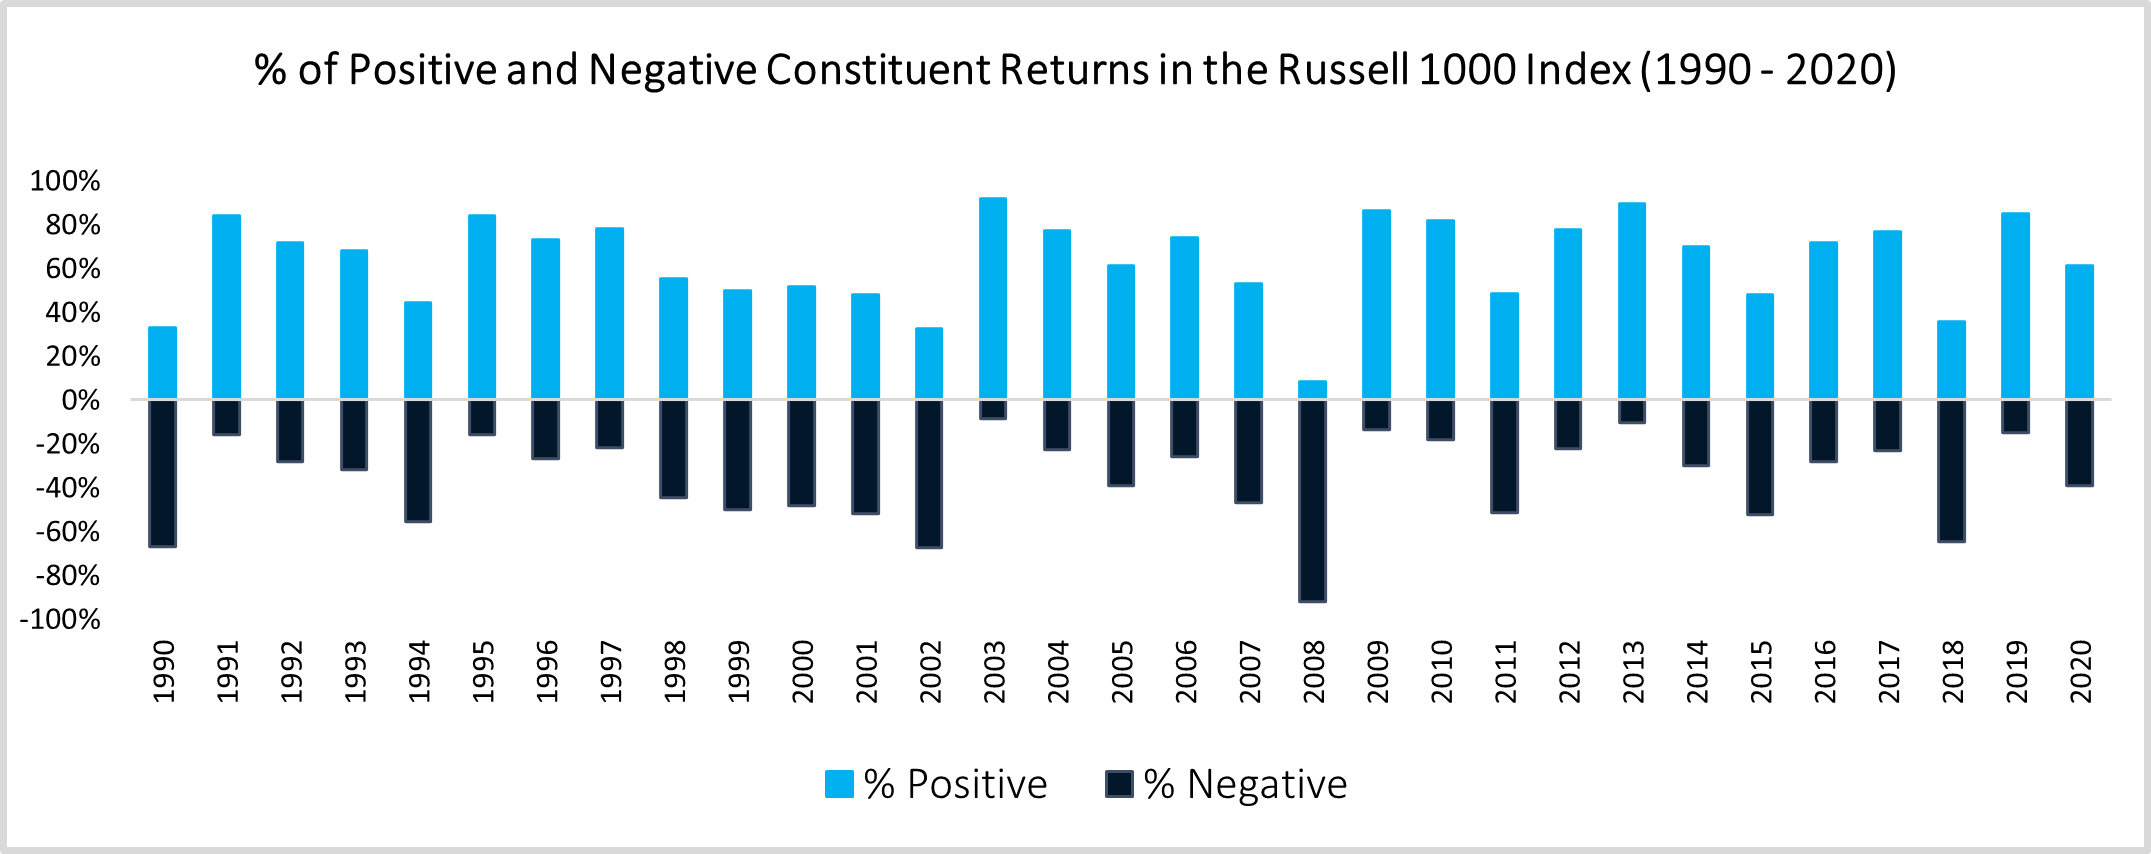
Since they only owned shares of the ETF (not its underlying holdings), investors in a Russell 1000 ETF could not harvest any losses. Selling shares of the ETF would trigger capital gains taxes because the 2020 return was positive.
Alternatively, a Custom Index replicating that passive exposure could harvest losses on the 39% of stocks with negative returns. These losses can help offset the client’s tax bill from capital gains.
The fully passive Custom Index below offers a good example.3 By opportunistically harvesting losses throughout the year, the account maintained a similar return and risk profile to the Russell 3000 while generating +77 bps of tax alpha unattainable through comparable ETFs.
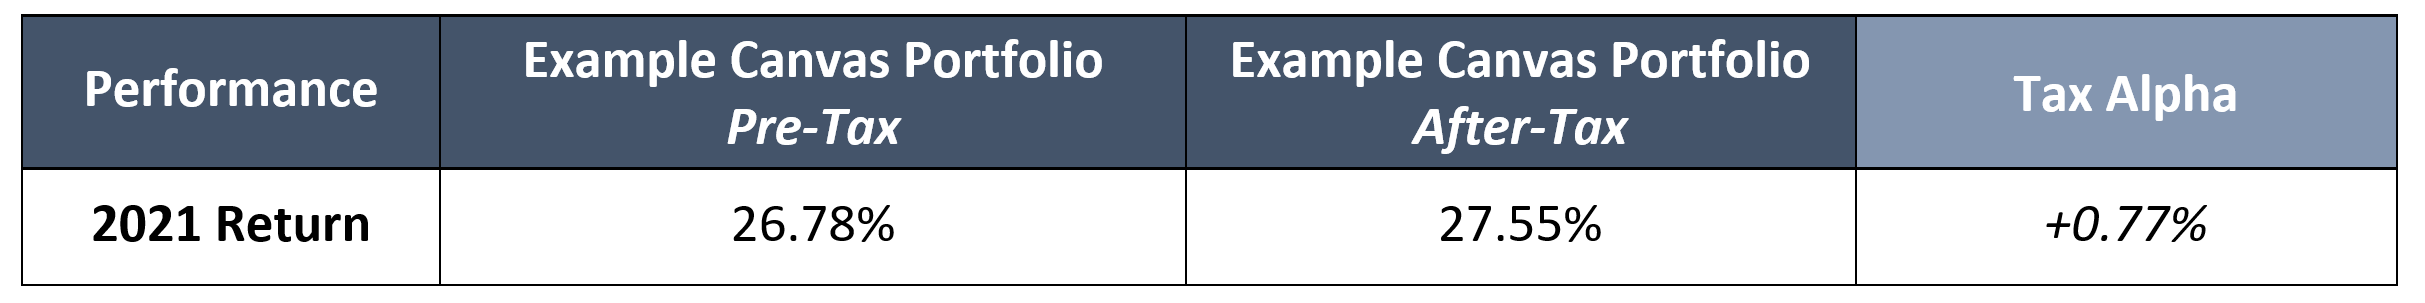
So, yes, ETFs are more tax efficient than mutual funds, but this is the wrong benchmark. As new technology makes tax management easier and more effective in other vehicles, advisors should focus on what ETFs cannot do:
- Tax loss harvesting at the individual lot level.
- Opportunistically harvest losses throughout the year at the lot level to take advantage of unique opportunities (like COVID in March 2020) that fall outside traditional year-end harvesting.
- Customize each client’s individual tax parameters by setting annual tax budgets.
ETFs bar investors from the benefits of more sophisticated tax management capabilities and the ability to customize each client’s tax guidelines.
SCALABILITY & CUSTOMIZATION
From a business perspective, ETFs are popular with advisors because of their easy implementation and scalability. However, there is a misconception that managing a suite of model ETF/Mutual Fund portfolios is more scalable than a separately managed account Custom Index. This is understandable, as the thought of every client having a personalized portfolio conjures images of chaotic spreadsheets and treating every client’s portfolio individually. In other words, the opposite of scalable.
We offer two counterpoints:
- From our conversations with advisors, the scalability of ETF and mutual fund models seems to be exaggerated. Many firms we’ve talked to complained how time consuming it was to trade and manage their model ETF/mutual fund portfolios, which took valuable time away from interacting with clients.
- Custom Indexing is innovative because it offers deep customization without sacrificing scalability. This is enabled by a platform approach that centralizes key portfolio management functionalities in one place. Model portfolio creation and customization on one platform. “Mass customization”.
Mass Customization
The model portfolio construction process can be viewed as two phases: Setting the Allocation (Building Model Portfolios) and Customization. Both ETFs and Custom Indexes offer Phase 1, but only Custom Indexes can offer the customization in Phase 2.
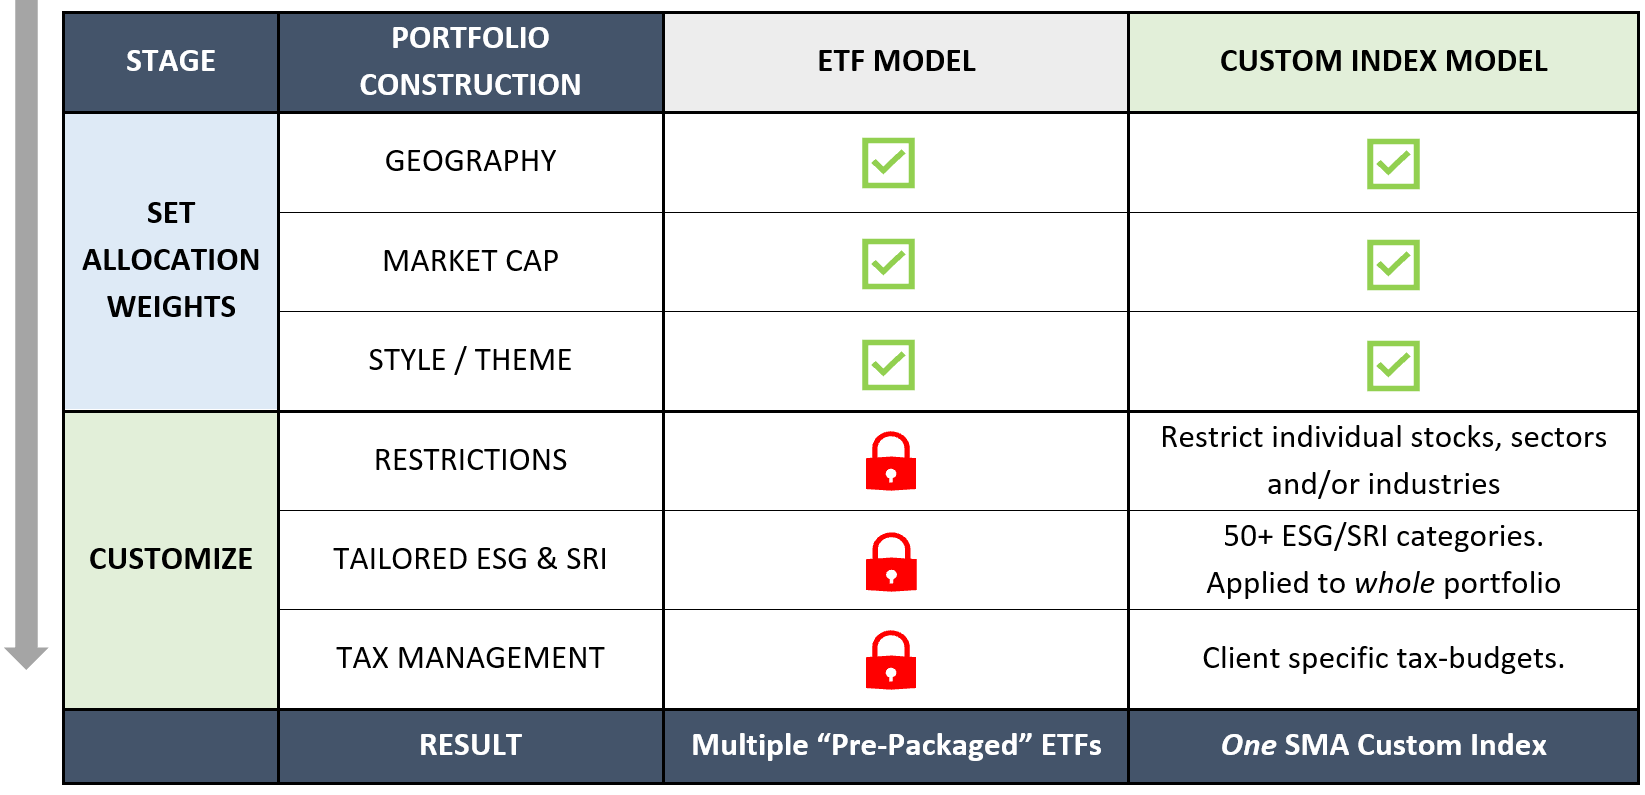
As shown, only Custom Indexes can offer the second phase: unique customization at scale. For asset managers with a long history of running SMA strategies and leveraging technology, account-specific customizations are nothing new. Each customization built on top of an underlying model is just a change to the “ruleset” programmatically managing and trading each account. This automated process enables mass customization at scale with just a few clicks.
Managing Transition Costs and Tax Impact
Understandably, advisors considering Custom Indexing over model ETF portfolios may have concerns over logistical issues like the tax costs of transitioning incumbent portfolios to a Custom Index. As a technology enabled platform, Canvas offers (as should Custom Indexing peers) a dynamic and customizable tool for transitioning incumbent portfolios in a manner that satisfies the advisor and end client.
Advisors can upload an existing holdings file and design a tax-managed road map for realizing and transitioning embedded gains. This tool includes the ability to set a customized tax budget for transitioning the client’s portfolio that allows advisors and their clients to view the tax cost, proximity to target model, and improvement in characteristics associated with their transition choices.
MANAGING CONCENTRATED RISK
The final dimension of comparison is a problem that our firm only truly appreciated after working with the advisors at our Canvas partner firms: managing concentrated stock risk. This generally occurs when a client is an early employee or executive at a company and has much of their net worth tied to company stock held at a very low-cost basis.
Advisors explained the difficulties of managing clients’ concentrated exposures alongside ETFs and mutual funds. Typically they spoke of liquidating a quarter of the postion each year over four years – agnostic of market and risk. Concentrated stock scenarios present many issues for both the client and advisor:
- Clients often have these concentrated exposures in their employer’s stock, meaning the client has significant investment risk and human capital risk tied to one company.
- Compared to the broader market, the average single stock generates lower returns and higher volatility. Having the majority of a client’s portfolio tied to one stock carries serious risk.
- Concentrated positions often have a low cost basis. This further complicates the issue, since reducing the position size by selling shares produces a sizable tax bill (from capital gains).
- Even when advisors recognize the risk of a concentrated position they cannot avoid increasing this exposure via passive ETFs. For example, if the client had 45% of their net worth in Apple, most U.S. equity indexed ETFs have Apple in their Top 10 Holdings.
- There is consensus that daily tax management is optimal but incredibly burdensome when done manually.
These issues highlight the challenge advisors face in managing concentrated positions overall, let alone with ETFs. Although each concentrated stock scenario is unique to one individual and one company, ETFs are structured to treat every investor the same. This mismatch creates headaches for the advisor and client. The answer is customization.
Custom Indexing produces innovative solutions for such challenging problems because it pairs the dynamism of owning individual securities in a separately managed account with sophisticated software and technology. Using this powerful combination to manage concentrated risk exposures, advisors using Canvas can:
- Build tailored portfolios that optimize around the concentrated risk by underweighting and/or excluding the concentrated stock itself, and “nearest neighbor” stocks with similar risk exposures.
- Leverage the power of tax loss harvesting to efficiently work down names by offsetting any capital gains with losses generated elsewhere in the Custom Index. In other words, use losses harvested on the 36% of stocks that lose annually to offset the taxes on capital gains generated by selling shares of the concentrated stock.
The following example represents a real-life Canvas portfolio where an advisor’s client started with a 45% weight to Accenture. The client’s advisor was eager to transition to a more diversified portfolio, but the position was owned at $0 cost basis.
Through active tax management (% of position sold each day labeled on the curve) the position was reduced to 14% in 8 months with zero net capital gains. This led the advisor to liquidate the position in August to fully achieve the target diversified model at a fraction of the cost and risk exposure.
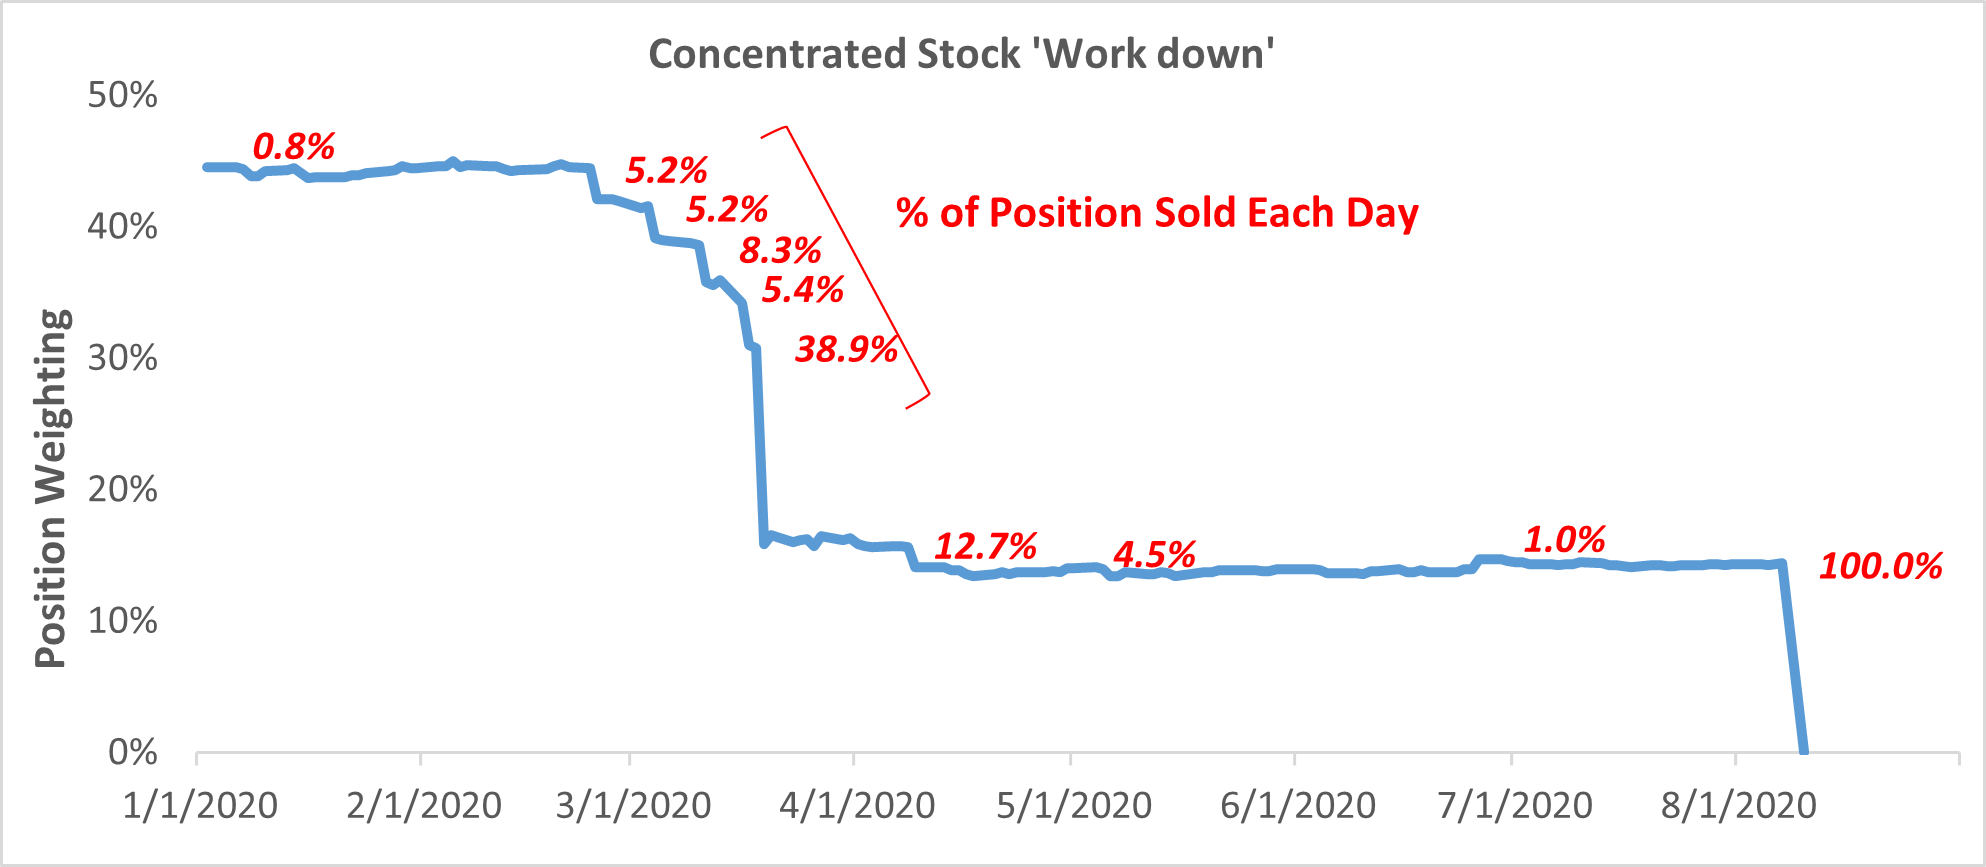
Of course, it is important to note that this occurred within the context of COVID-19, when markets cratered in the first half of 2020. However, regardless of market environment, technology enabled tax management greatly increases efficiency, improving tax outcomes.
For advisors, this example probably brings a few clients or prospects with similar situations to mind. Previously, advisors were left with little recourse for managing these positions as ETFs and mutual funds simply cannot offer the level of customization and dynamism required for working down the exposure of one stock. Custom Indexing now solves this problem in a matter of clicks.
CONCLUSION
Advisors should be excited. Whether you were an early embracer or late adopter of ETFs, Custom Indexing offers another rare opportunity to challenge the status quo and deliver value to clients.
In every other facet of life we crave personalization over commodification. Choosing between a tailored dress/suit and mass-produced off-the-rack option, most prefer the tailored – especially when priced equally. Investing will be no different.
ETFs lock advisors and their clients into the same positions as every other investor holding the same ETF, regardless of risk profile, income, time horizon, etc. It is inevitable that clients will demand to be treated as the unique individuals that they are, and Custom Indexing enables you to meet this need.
There is a reason that industry giants are acquiring companies that specialize in Custom Indexing / Direct Indexing. Even the world’s largest ETF provider, BlackRock, is preparing for this future by acquiring a Direct Indexing provider. In the past, personalized investing was restricted to wealthy clients with large accounts. However, technology and commission-free trading have brought this offering to the masses.
Looking five to ten years into the future, do you think more clients will own personalized or pre-packaged portfolios? If it is the former, we’d love to speak with you further about Custom Indexing.
FOOTNOTES
1 Himanshu Seth, Shalini Talwar, Anuj Bhatia, Akanksha Saxena, Amandeep Dhir, ‘Consumer Resistance and Inertia of Retail Investors: Development of the Resistance Adoption Inertia’, Journal of Retailing & Consumer Services (Vol. 55, 2020)
2 https://www.pionline.com/special-report-index-managers/passive-assets-rise-359-2087-trillion-strong-returns (As of June 30,2021)
3 This example account has an 85% passive allocation to US Large Cap, and 15% passive allocation to US Small-Mid Cap.
Important Legal, Canvas®, Hypothetical and/or Back-tested Disclosure Information
CANVAS® is an interactive web-based investment tool developed by O’Shaughnessy Asset Management, L.L.C. (“OSAM”) that permits an investment professional (generally a registered investment advisor or a sophisticated investor) to select a desired investment strategy for the professional’s client. At all times, the investment professional, and not OSAM, is responsible for determining the initial and ongoing suitability of any investment strategy for the investment professional’s underlying client. The professional’s client shall not rely on OSAM for any such initial or subsequent review or determination. Rather, to the contrary, at all times the professional shall remain exclusively responsible for same. See more about CANVAS below and Release and Hold Harmless at the end of this Important Disclosure Information.
Reliance on Investment Professional: OSAM has relied, and shall continue to rely, on the investment professional’s knowledge and experience to understand the inherent limitations of the performance presentation, including those pertaining to back-tested hypothetical performance. All performance presentations, including hypothetical performance, are the direct result of the investment professional’s request, independent of OSAM. Depending upon the investment professional’s direction and selection, hypothetical presentations can include both OSAM and non-OSAM Models and/or strategies. The below discussion as to the material limitations of back-tested hypotheticals apply to both OSAM and non-OSAM Models and/or strategies.
Intended Recipient: CANVAS content is intended for the investment professional only not to be shared with an underlying client unless in conjunction with a meeting between the investment professional and its client in a one-on-one setting. OSAM assumes that no hypothetical performance-related content will be provided directly to the professional’s client without the accompanying consultation and explanation of the professional. The content is intended to assist the professional in evaluating the appropriate investment strategy for the professional’s client.
OSAM Models. OSAM has devised various investment models (the “Models”) for CANVAS, the objectives of each are described herein. The investment professional is not obligated to consider or utilize any of the Models. As indicated above, at all times, the investment professional, and not OSAM, is responsible for determining the initial and ongoing suitability of any Model for the investment professional’s underlying client. Model performance reflects the reinvestment of dividends and other account earnings and are presented both net of the maximum OSAM’s investment management fee for the selected strategy and gross of an OSAM investment management fee. Please Note: As indicated at Item 5 of its written disclosure Brochure, OSAM’s CANVAS management fee ranges from 0.20% to 1.15%. The average percentage management fee for all CANVAS strategies is 0.36%. The percentage OSAM management fee shall depend upon the type of strategy and the corresponding amount of assets invested in the strategy; generally, the greater the amount of assets, the lower the percentage management fee. Please Also Note: The performance also do not reflect deduction of transaction and/or custodial fees (to the extent applicable), the incurrence of which would further decrease the performance. For example, if reviewing a strategy with a ten-year return of 10.0% each year, the effect of a 0.10% transaction/custodial fee would reduce the reflected cumulative returns from 10.0% to 9.9% on a 1-year basis, 33.1% to 32.7% on a 3-year basis, 61.1% to 60.3% on a 5-year basis and 159.4% to 156.8% on a 10-year basis respectively. Please Further Note: Transaction/custodial fees will differ depending upon the account broker-dealer/custodian utilized. While some broker-dealers/custodians do not charge transaction fees for individual equity (including ETF) transactions, others do. Some custodians charge fixed fees for custody and execution services. Choice of custodian is determined by the investment professional and his/her/its client. Higher fees will adversely impact account performance.
OSAM does not maintain actual historical performance results for the Models. In order to help assist the investment professional in determining whether a Model is appropriate for the professional’s client, OSAM has provided back-tested hypothetical (i.e., not actual) performance for the Model. OSAM, with minor deviations that it does not consider to be material*, currently uses the Models (i.e., live models vs. the reflected back-tested versions thereof) to manage actual client portfolios (see Model Deviations below). The performance reflects the current Model holdings, which are subject to ongoing change.
Material Limitations: The Performance is subject to material limitations. Please see Hypothetical/Material Limitations below. During any specific point in time or time-period, the Models, as currently comprised, performed better or worse, with more or less volatility, than corresponding recognized comparative indices, benchmarks or blends thereof.
Past performance may not be indicative of future results. Therefore, it should not be assumed that future performance of any specific investment or investment strategy (including the Models), will be profitable, equal any historical index or blended index performance level(s), or prove successful. Historical index results do not reflect the deduction of transaction and custodial charges, or the deduction of an investment management fee, the incurrence of which would have the effect of decreasing indicated historical performance results. The Russell 3000 is a market capitalization-weighted index of 3000 widely held large, mid, and small cap stocks. Russell chooses the member companies for the Russell 3000 based on market size and liquidity. The MSCI All Country World Index is a market capitalization weighted index designed to provide a broad measure of equity-market performance throughout the world. The MSCI is maintained by Morgan Stanley Capital International and is comprised of stocks from 23 developed countries and 24 emerging markets. The Barclays Capital Aggregate Bond Index is a market capitalization-weighted index, meaning the securities in the index are weighted according to the market size of each bond type. Most U.S. traded investment grade bonds are represented. Municipal bonds and Treasury Inflation-Protected Securities are excluded, due to tax treatment issues. The index includes Treasury securities, Government agency bonds, Mortgage-backed bonds, corporate bonds, and a small amount of foreign bonds traded in U.S. The historical performance results for the Russell 3000, MSCI and Barclays are provided exclusively for comparison purposes only, to provide general comparative information to help assist in determining whether a Model or other type strategy (relative to the reflected indices) is appropriate for his/her investment objective and risk tolerance. Please Also Note: (1) Performance does not reflect the impact of client-incurred taxes; (2) Neither Model or the selected strategy holdings correspond directly to any such comparative index; and (3) comparative indices may be more or less volatile than the Model or selected strategy.
Hypothetical/Material Limitations-performance reflects hypothetical back-tested results that were achieved by means of the retroactive application of a back-tested portfolio and, as such, the corresponding results have inherent limitations, including: (a) the performance results do not reflect the results of actual trading using investor assets, but were achieved by means of the retroactive application of the Model or strategy (as currently comprised), aspects of which may have been designed with the benefit of hindsight; (b) back tested performance may not reflect the impact that any material market or economic factors might have had on OSAM’s (or the investment professional’s) investment decisions for the Model or the strategy; and, correspondingly; (c) had OSAM used the Model to manage actual client assets (or had the investment professional used the selected strategy to manage actual client assets) during the corresponding time periods, actual performance results could have been materially different for various reasons including variances in the investment management fee incurred, transaction dates, rebalancing dates (increases account turnover), market fluctuation, tax considerations (including tax-loss harvesting-increases account turnover), and the date on which a client engaged OSAM’s investment management services.
MORE ABOUT CANVAS®
CANVAS® is an interactive web-based investment tool developed by O’Shaughnessy Asset Management, L.L.C. (“OSAM”) that permits an investment professional (generally a registered investment advisor or a sophisticated investor) to select a desired investment strategy (the “Strategy”) for the professional’s client. At all times, the investment professional, and not OSAM, is responsible maintaining the initial and ongoing relationship with the underlying client and rendering individualized investment advice to the client. In addition, the investment professional and not OSAM, is exclusively responsible for:
- determining the initial and ongoing suitability of the Strategy for the client;
- devising or determining the specific initial and ongoing desired Strategy;
- monitoring performance of the Strategy; and,
- modifying and/or terminating the management of the client’s account using the Strategy.
Hypothetical Limitations: To the extent that the investment professional seeks for CANVAS to provide hypothetical back-tested performance, material limitations apply-See above.
Model Deviations: As indicated above, OSAM, with minor deviations that it does not consider to be material*, currently use the Models to manage actual client portfolios (i.e., the live Models). The deviations include:
- the use of proxies if and when an ETF used in the back-test was not available*. While the back-tested and live strategies both utilize the same investment themes, back-tested proxies can deviate from live models based on limitations of historical information;
- back-tested data presented utilizes a month-end rebalance while actual live model performance reflects intra-month rebalances;
- OSAM, as a discretionary manager, can update its live models as determined necessary. These changes will then be applied retroactively to back-tested models, the resulting performance of which would be different than that of the actual historical models-see Hypothetical/Material Limitations above; and,
- Financial statement information may be restated over time, which information was not reflected in the historical back-tested models. Companies will also have mergers and acquisitions or other corporate events that can retrospectively affect the names and corporate identities of organizations in the historical back-tests. Data providers providing pricing and return information may update historical data upon discovering deficiencies or omissions.
Strategy Sampling Impact: The implementation of OSAM strategies utilize a sampling of the underlying individual Strategy positions, and, as the result thereof, the underlying securities’ weighting could unintentionally deviate +/- the Strategy allocation target OSAM calculates the CANVAS fees based on the mix of strategies that are utilized at the establishment of the account. Therefore, the sampling approach can cause deviations between the Canvas strategy allocation establishment (and its corresponding fee) and the implementation of that CANVAS strategy.
ESG Portfolios/Socially Responsible Investing Limitations. To the extent applicable to the strategy chosen by the investment professional, Socially Responsible Investing involves the incorporation of Environmental, Social and Governance considerations into the investment due diligence process (“ESG). There are potential limitations associated with allocating a portion of an investment portfolio in ESG securities (i.e., securities that have a mandate to avoid, when possible, investments in such products as alcohol, tobacco, firearms, oil drilling, gambling, etc.). The number of these securities may be limited when compared to those that do not maintain such a mandate. ESG securities could underperform broad market indices. Investors must accept these limitations, including potential for underperformance. Correspondingly, the number of ESG mutual funds and exchange-traded funds are few when compared to those that do not maintain such a mandate. As with any type of investment (including any investment and/or investment strategies recommended and/or undertaken by OSAM), there can be no assurance that investment in ESG securities or funds will be profitable or prove successful.
Tax Management Function: When requested by the investment professional, OSAM will use best efforts to work within Onboarding Budgets, Annual Tax Budgets, and Tracking Error Budgets. However, market and/or specific stock price fluctuations can occur quickly and can correspondingly adversely affect our ability to manage to specified budgets. Additionally, changes to tax budgets, cash flows in and out of an account, mandatory corporate actions, and funding with securities can also impact preciseness. The investment professional must accept this risk. In addition:
- OSAM has not, and will not, verify the accuracy of any tax-related information provided;
- In the event that any such information provided is inaccurate or incomplete, the corresponding results will be inaccurate or incomplete;
- Tracking Error Budgets are relative to the Model, not the benchmark;
- OSAM is not a CPA and this is not tax advice;
- Tax laws and rates change;
- While we seek to follow the investment professional prescribed target models, ranges, timeframes, tax budgets, and seek not to create wash sales or exceed expected tax budgets, there can be no assurance that the CANVAS tool will be able to accurately do so;; and,
- For specific personalized tax-related advice, consult with a CPA or other tax professional.
Fixed Income ETF Model-The models are constructed using passive fixed income ETFs. The models attempt to target varying levels of duration and credit exposure relative to the Barclays Aggregate Index. The expense ratios of the underlying ETF’s are born by the investor and are separate and apart from CANVAS related fees.
Miscellaneous Limitations/Issues:
- Results in the Transition Portal reflect expense ratios corresponding to the specific funds indicated/provided by the investment professional. Expense ratios are provided by an unaffiliated database. Results also reflect projected future yields corresponding to such current indicated funds. Such data may not be precise;
- The risk-free rate used in the calculation of Sortino, Sharpe, and Treynor ratios is 5%, consistently applied across time;
- OSAM did not begin to offer CANVAS until April 2019. Prior to 2007, OSAM did not manage client assets; and,
- A copy of OSAM’s written disclosure Brochure, Form CRS and Privacy Notice remains available on this CANVAS website or at www.osam.com.
Release and Hold Harmless
The professional, to the fullest extent permitted under applicable law, agrees to release, defend, indemnify and hold OSAM (including its officers, directors, members, owners, employees, agents, and affiliates) harmless from any and all adverse consequences, financial or otherwise, of any type or nature arising from or attributable to the professional’s access to, and use of, CANVAS, including, but not limited to, any claims for alleged or actual client losses or damages of any kind or nature whatsoever (including without limitation, the reimbursement of reasonable attorney’s fees, costs and expenses incurred by OSAM relating to investigating or defending any such claims and/or demands), except to the extent that actual losses are the direct result of an act or omission by OSAM that constitutes willful misfeasance, bad faith or gross negligence as adjudged by a court of final jurisdiction.
*except in the unlikely event that the performance of the proxy used in lieu of the actual ETF was materially different (positive or negative)
Lastly, please be advised, without limitation, OSAM shall not be liable for Losses resulting from or in any way arising out of (i) any action of the investor or its previous advisers or other agents, (ii) force majeure or other events beyond the control of OSAM, including without limitation any failure, default or delay in performance resulting from computer or other electronic or mechanical equipment failure, unauthorized access, strikes, failure of common carrier or utility systems, severe weather or breakdown in communications not reasonably within the control of OSAM, inaccuracy or incompleteness of any third-party data, or other causes commonly known as “acts of God,” or (iii) general market conditions. Under no circumstances shall OSAM be liable for consequential, special, incidental or indirect damages, punitive damages, or lost profits or reputational harm. Additionally, the responsibility solely rests on the “master user” of CANVAS at each independent firm, and NOT OSAM, to close out any associated users who may terminate at any time.
O’Shaughnessy Asset Management, LLC (OSAM) is a wholly owned subsidiary of Franklin Resources Inc./(Franklin Templeton).


