Life Cycle Investing
By Ehren Stanhope
September 2021
A Canvas partner recently asked us to generate a solution for a common investment problem:
“A 62-year-old investor has a $2.5 million portfolio that they need to last through retirement while drawing $100 thousand annually for living expenses. How would you construct a portfolio to fund that?”
Inherent in the problem are dual and competing objectives. On one hand, the investor has a multi-decade horizon and can harness the power of high returning, but more volatile, equity investments. On the other hand, the portfolio must fund short-term current needs in a way that does not erode principal.
The first challenge in tackling this problem is analytical. The future path of financial markets, interest rates, and inflation is unknown. While software exists that incorporates sophisticated hypothetical analysis, assumption upon assumption is required and the output is highly sensitive to those inputs.
The second key challenge is the present. While the future is unknown, the starting point—current conditions—is known. Bond yields are low and equity valuations are high. When 10-year government bonds yielded greater than 5% prior to the Global Financial Crisis (GFC), a 60% equity/40% government bond portfolio did the trick quite well. Equities served as the driver of principal appreciation and purchasing power preservation. Equity pullbacks were counterbalanced by appreciating bond prices, which stabilized aggregate portfolio value, preserved principal, and generated income for withdrawals.
Today, the bond component is middling at best with bonds and stocks yielding in the very low single digits. Given that a decent predictor of a bond’s future return is its current yield, it seems unlikely that bonds will serve as much more than a volatility hedge for the foreseeable future. This ups the ante for stocks in balanced portfolios. The equity allocation now needs to play a role in minimizing volatility and portfolio drawdowns.
Investment Levers
There are four primary investment levers available on the Canvas platform that we evaluated to tackle this problem. Each plays a specific role in the client portfolio. In our experience building portfolios with Canvas partners, the whole tends to be greater than the sum of the parts over time because different elements in the portfolio shine during different market regimes.
Passive Beta
Many portfolios we build include passive beta. While we, and many of our clients, believe strongly in the power of factors, there is no question that passive exposure can play a role in portfolios. For taxable accounts, passive exposure can often be viewed as the driver of Tax Alpha—the systematic harvesting of losses to enhance after-tax returns.
Factor Alpha
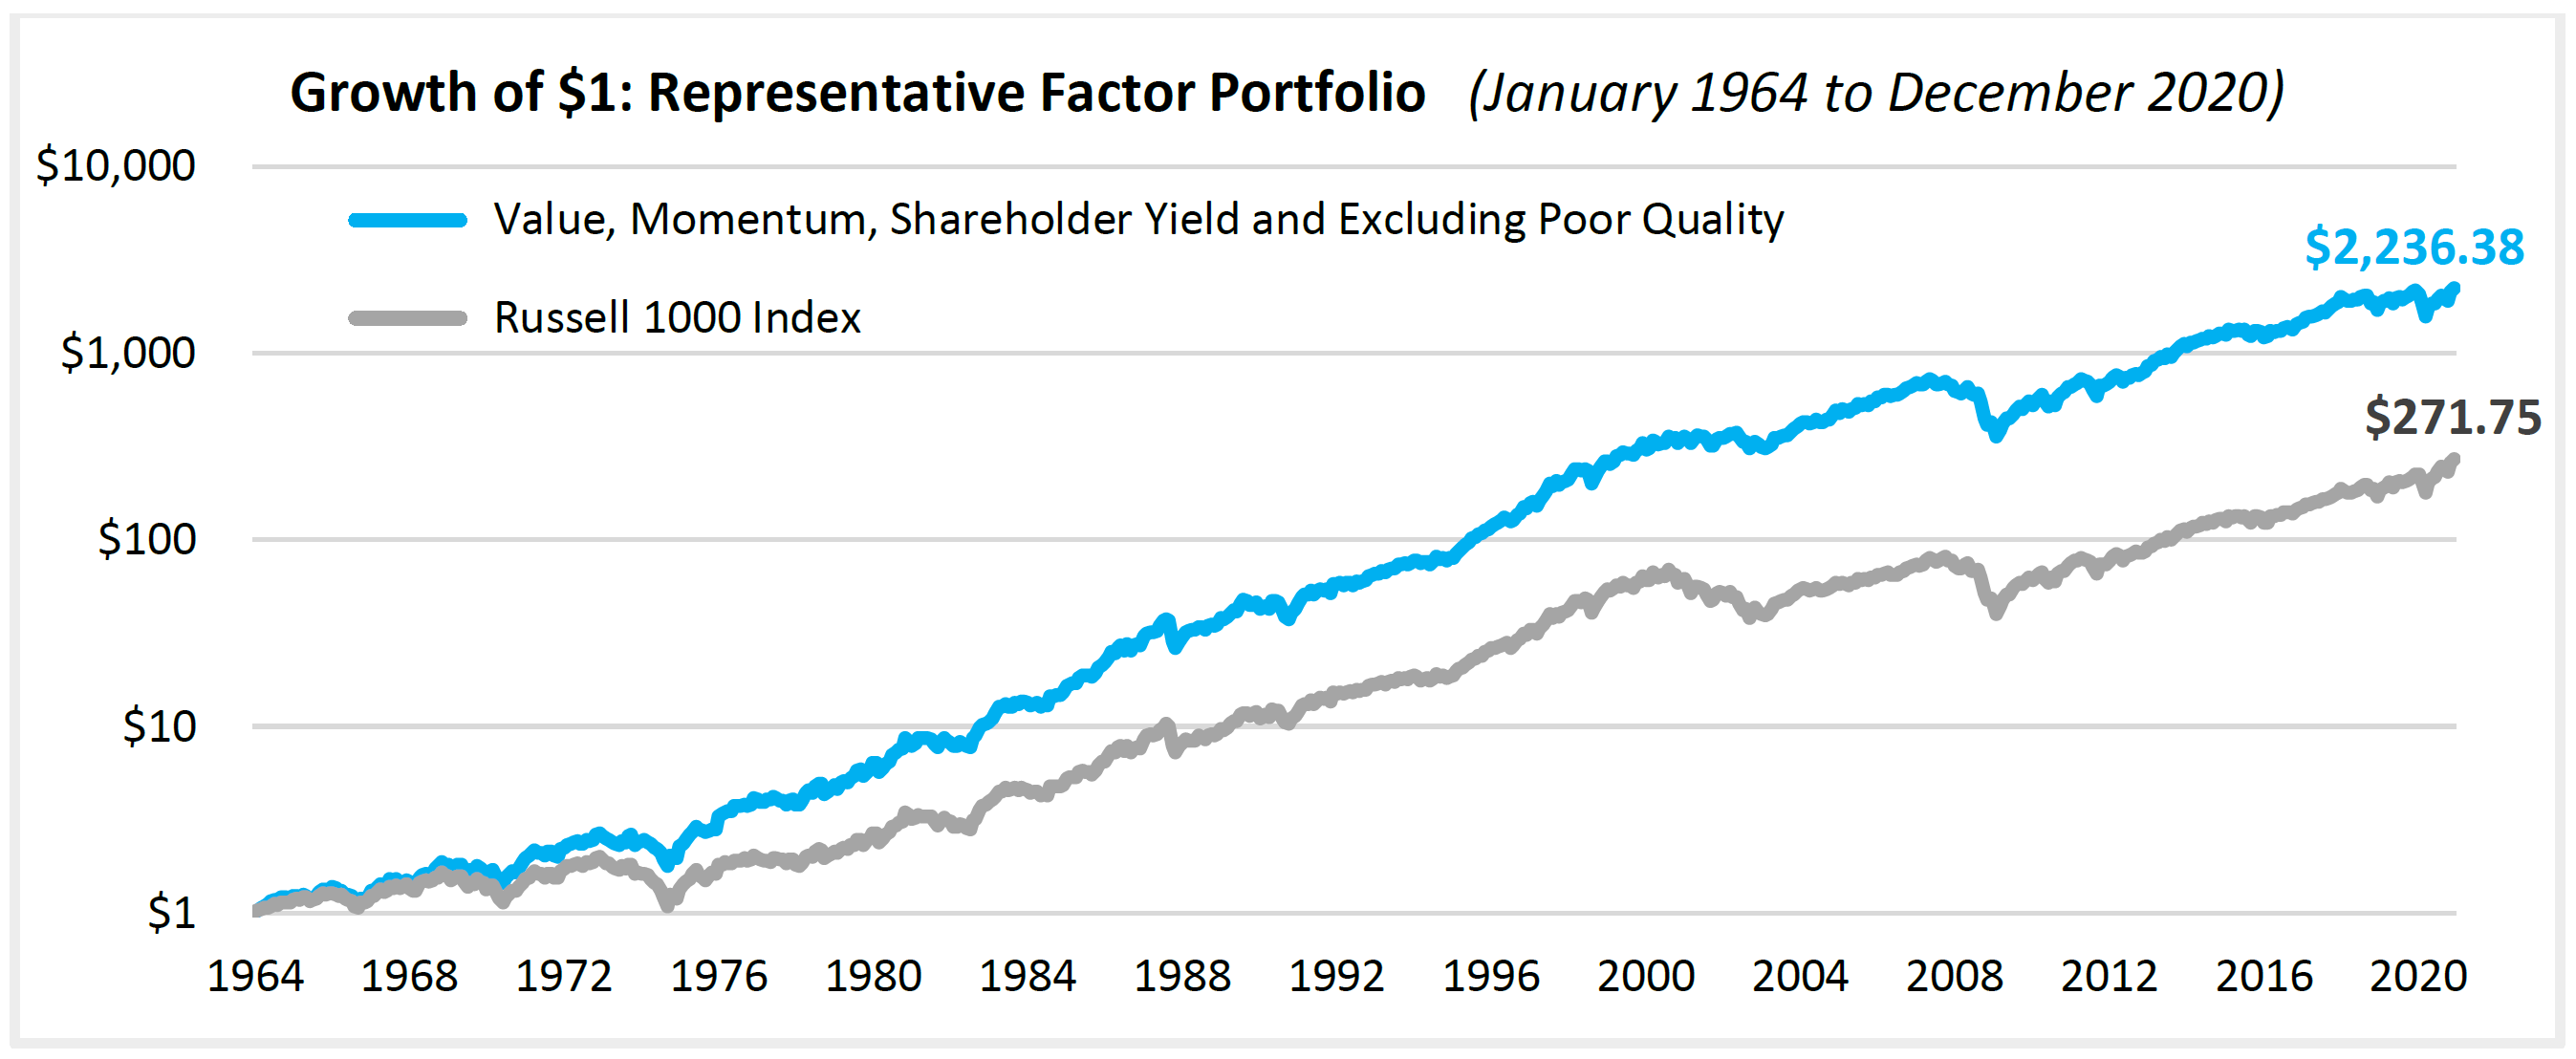
Factors are characteristics, like Price-to-Earnings or Dividend Yield, of a stock that historically predispose certain stocks to outperform. Factor exposure can enhance total portfolio returns. Based on decades of historical research, we’ve identified three stock selection themes that we believe can generate strong total and risk-adjusted returns—Value, Momentum, and Shareholder Yield. We combine these selection factors with quality screens for Earnings Quality, Financial Strength, and Earnings Growth to create allocations on the platform across the U.S., Developed, and Emerging Markets.
Defensive Stability
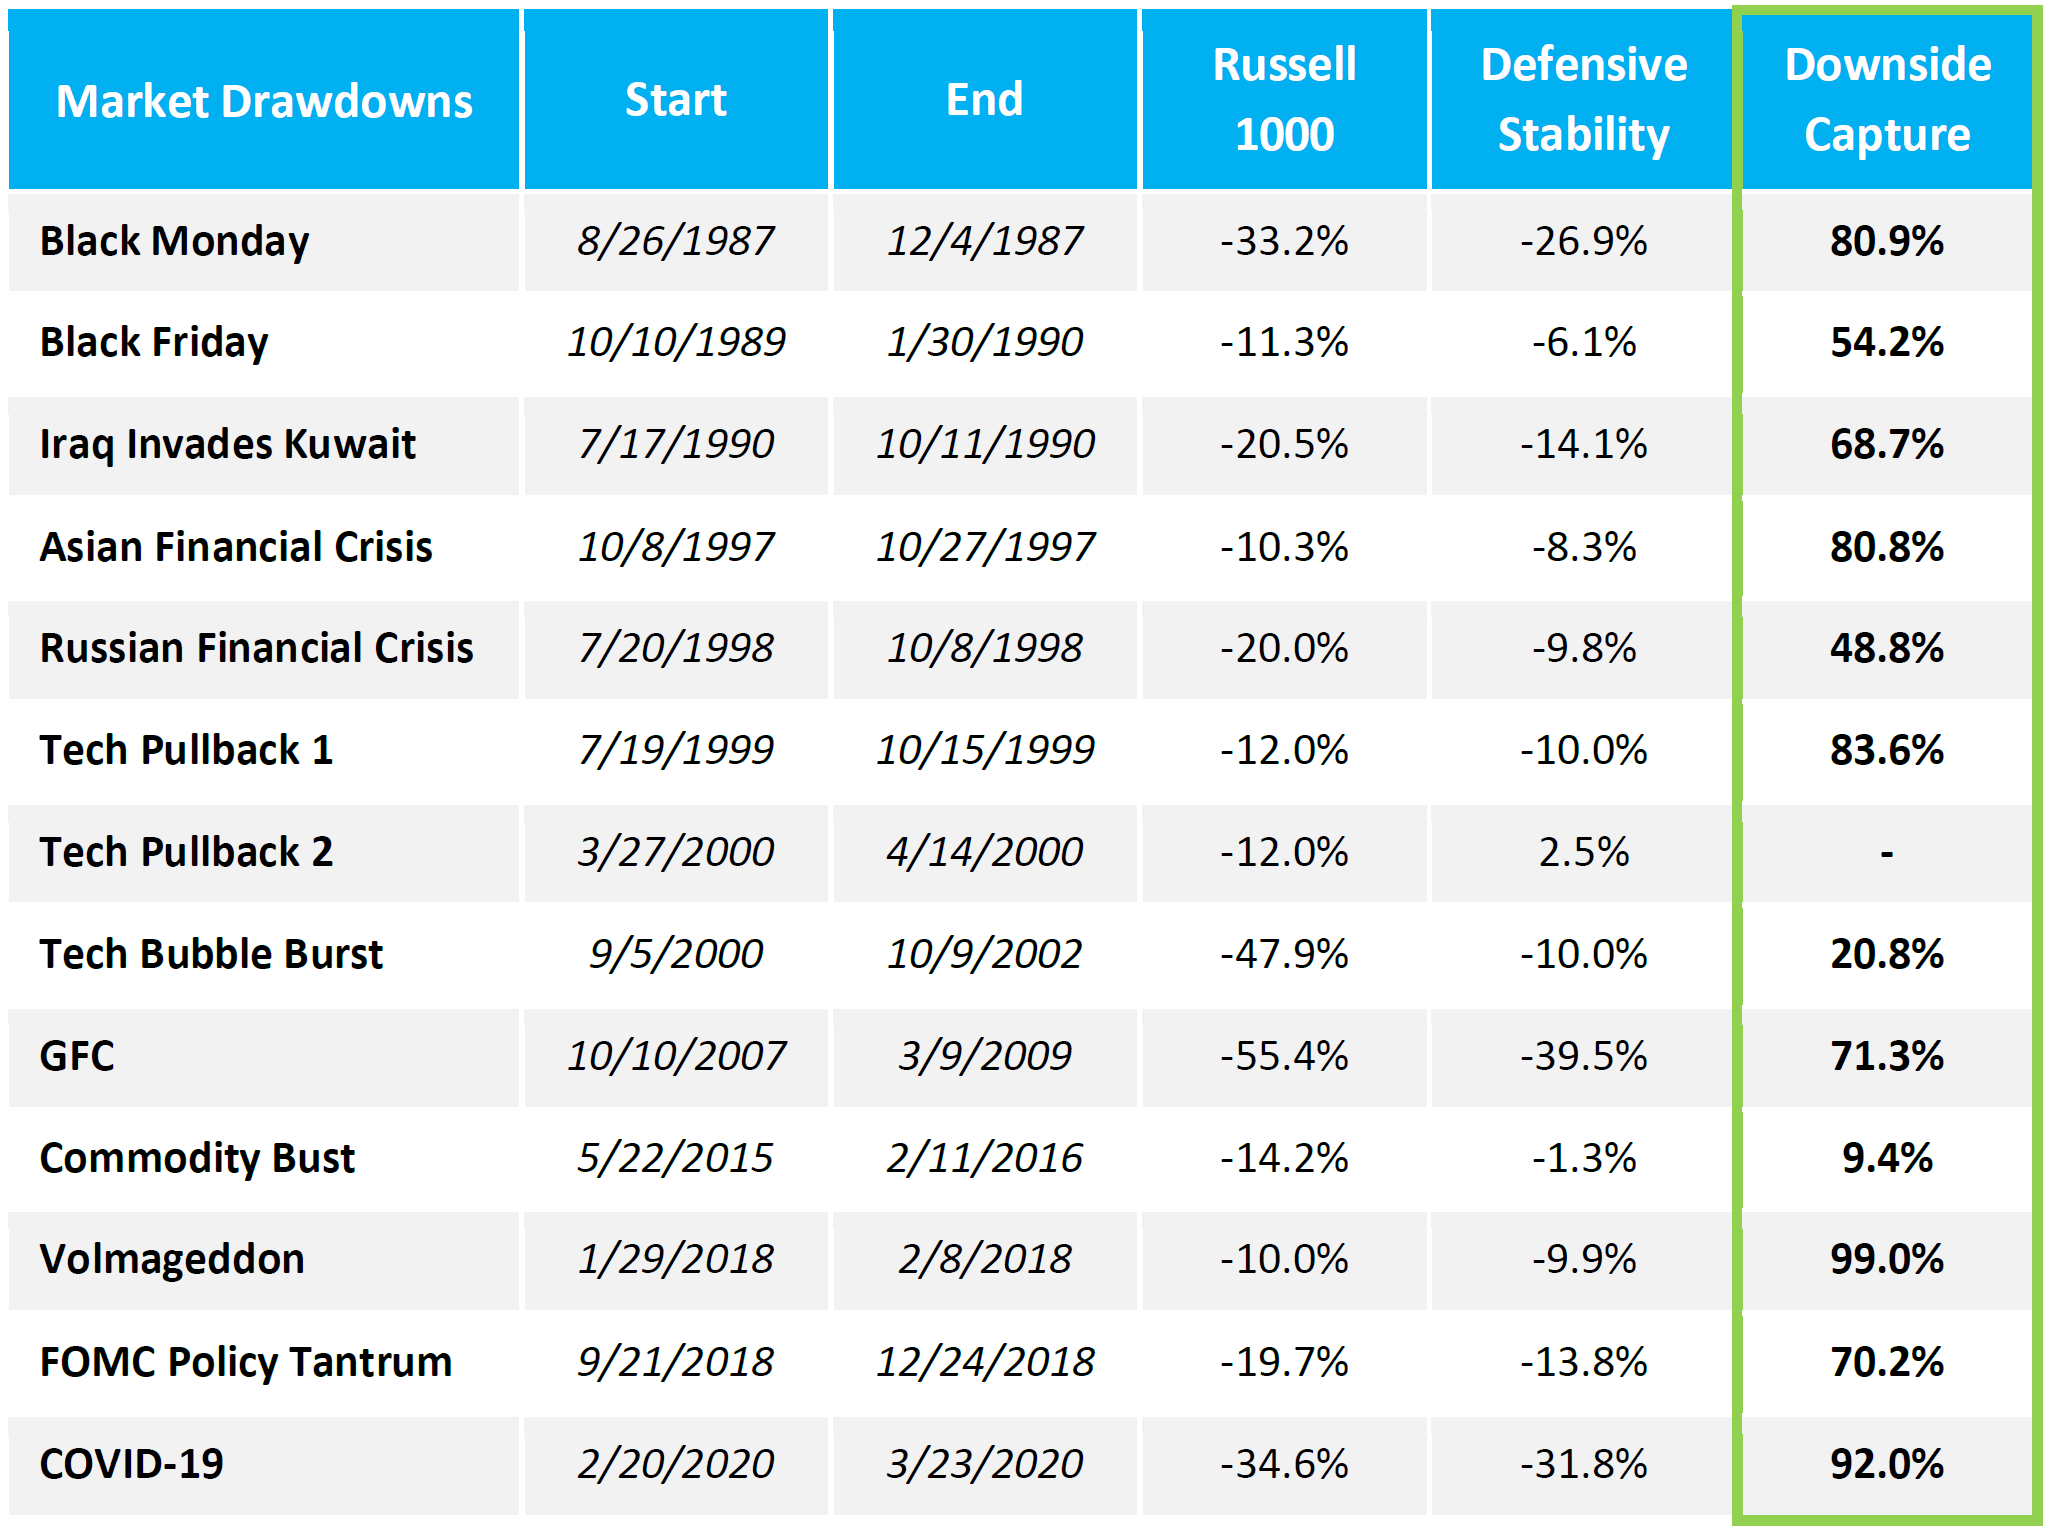
Markets tend to appreciate about 70% of calendar years. Factor allocations tend to generate alpha in those up markets and so are favorable for capturing alpha on the upside. In the 30% of years when markets are down, it is advantageous to own assets that provide some level of downside protection. While equity strategies in general will decline in market downturns, declining less than the overall market can be a source of “alpha”. We haven’t come across a method yet to predict when those down years will occur, so it can be prudent to allocate a portion of the portfolio to defensive strategies to protect in those periodic down markets.
Within Canvas, we have created an investment option that screens out low quality stocks and then focusses in on those with stability of revenue, cash flow, return of capital management, and stock price. This tends to generate favorable downside protection and can be a ballast for equity portfolios when used alongside Factor Alpha allocations.
Based on our research, below is scenario analysis on how a stand-alone allocation to our Defensive Stability option might have performed historically.
Fixed Income
Fixed income historically serves three roles in a portfolio: 1) a source of income; 2) a volatility reducer; 3) a hedge against deflation. The traditional role of fixed income for income generation is currently obsolete given the low level of interest rates. The second and third role of volatility dampener and deflation hedge are still reason enough to include fixed income in allocations that require recognition of current funding needs. In this case study, the objective of generating current income necessitates controlling overall portfolio volatility.
Within Canvas, we offer 25 unique fixed income allocations built using fixed income ETFs and targeting duration, credit risk, and yield exposures.
Building the Allocation
Given the stated problem, the portfolio needs to provide stability of principal and downside protection while appreciating to keep pace with inflation and living expenses. This involved two key considerations:
· Income generation is important, but at current yield levels, the strategic withdrawal of principal for living needs is warranted.
· The portfolio should deliver a combination of downside protection, volatility control, income generation and growth to keep pace with inflation, given the likelihood of the client needing to live from the portfolio’s “Total Take Home” for an extended period.
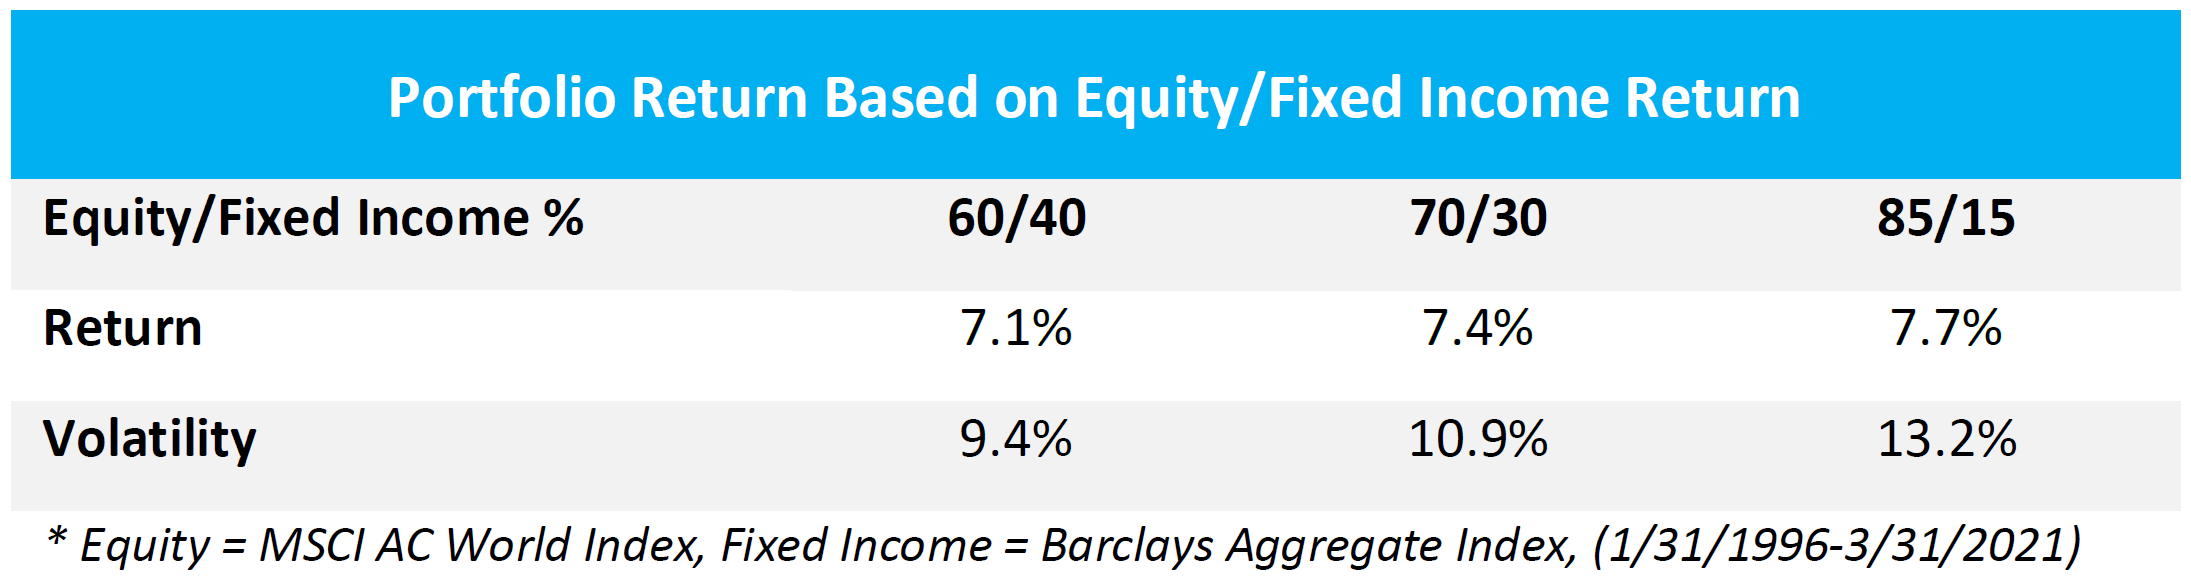
The first step in the process of building the allocation was determining a reasonable level of volatility. A passive 60% equity / 40% fixed income allocation tends to do the trick for more conservative investors. Historically, the volatility on such a portfolio is about 9.4% annualized when including pure passive investments.
From this starting point, we layered in choices for exposure to geography, Factor Alpha, and Defensive Stability to attempt to improve upon the passive results above.
Geography
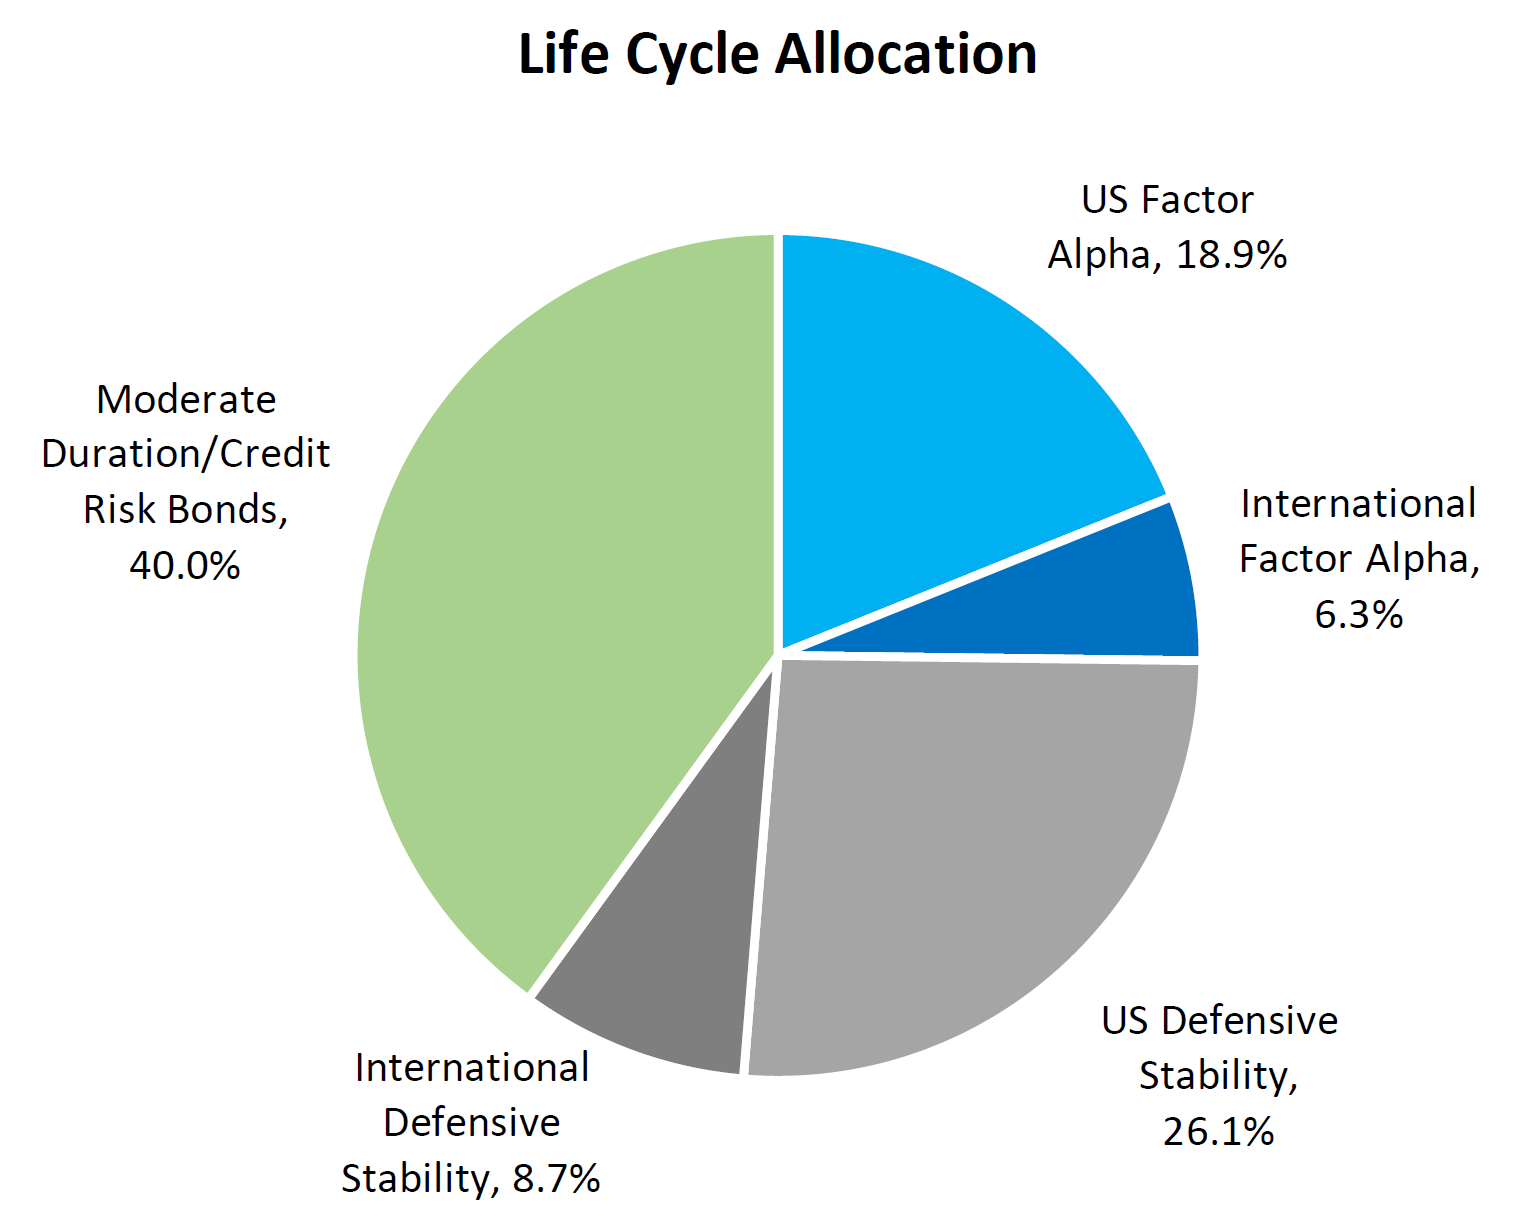
Though we have recently lived through a period of extended U.S. outperformance, historically there is a rotation between domestic and foreign stocks that generates diversification benefits. That said, foreign stocks generally tend to be more volatile due to currency effects. We wanted to acknowledge this in the allocation by overweighting the U.S., but still including foreign exposure. The U.S./foreign breakdown was set at 75%/25%, respectively.
Factor Alpha
Because equity markets tend to appreciate more often than they decline and factors historically outperform in up markets, we included a hefty allocation to Factor Alpha—about 42% of the total equity exposure. The allocation is spread equally across our three key selection factors of Value, Momentum, and Shareholder Yield.
Defensive Stability
Because the burden of volatility reduction will fall to the equity component as well, we incorporated Defensive Stability at 58% of the total equity exposure. This acts as a balance to the Factor Alpha allocation and serves to lower the equity allocation’s contribution to total portfolio volatility in all environments.
Passive Beta
We chose not to include passive in this portfolio because it hindered the ability to deliver return and downside protection needed to meet the dual mandate of inflation hedge and volatility control. Because Factor Alpha and Defensive Stability provide a different set of complementary exposures—one enhancing upside return, the other enhancing downside protection—the utility of passive in this allocation did not help achieve our dual mandate. An additional consideration is that Defensive Stability allocations tend to be low turnover and so contribute positively to tax management opportunities.
Fixed Income
We decided to allocate the full fixed income exposure (40%) to a Barclays Aggregate ETF. This represents a passive allocation to the U.S. bond market. The 60% equity / 40% fixed income split is trued up on an annual basis. Should the client or advisor decide to take a view on duration or credit that is different form this core passive exposure, our suite of fixed income ETF portfolios could accommodate any shifts in viewpoint.
The Results
The back-tested performance statistics exhibited below demonstrate that the combination of Defensive Stability, Factor Alpha, and Fixed Income provide a portfolio that has a lower maximum drawdown, higher Sharpe Ratio, and higher annualized return than the blended benchmark.
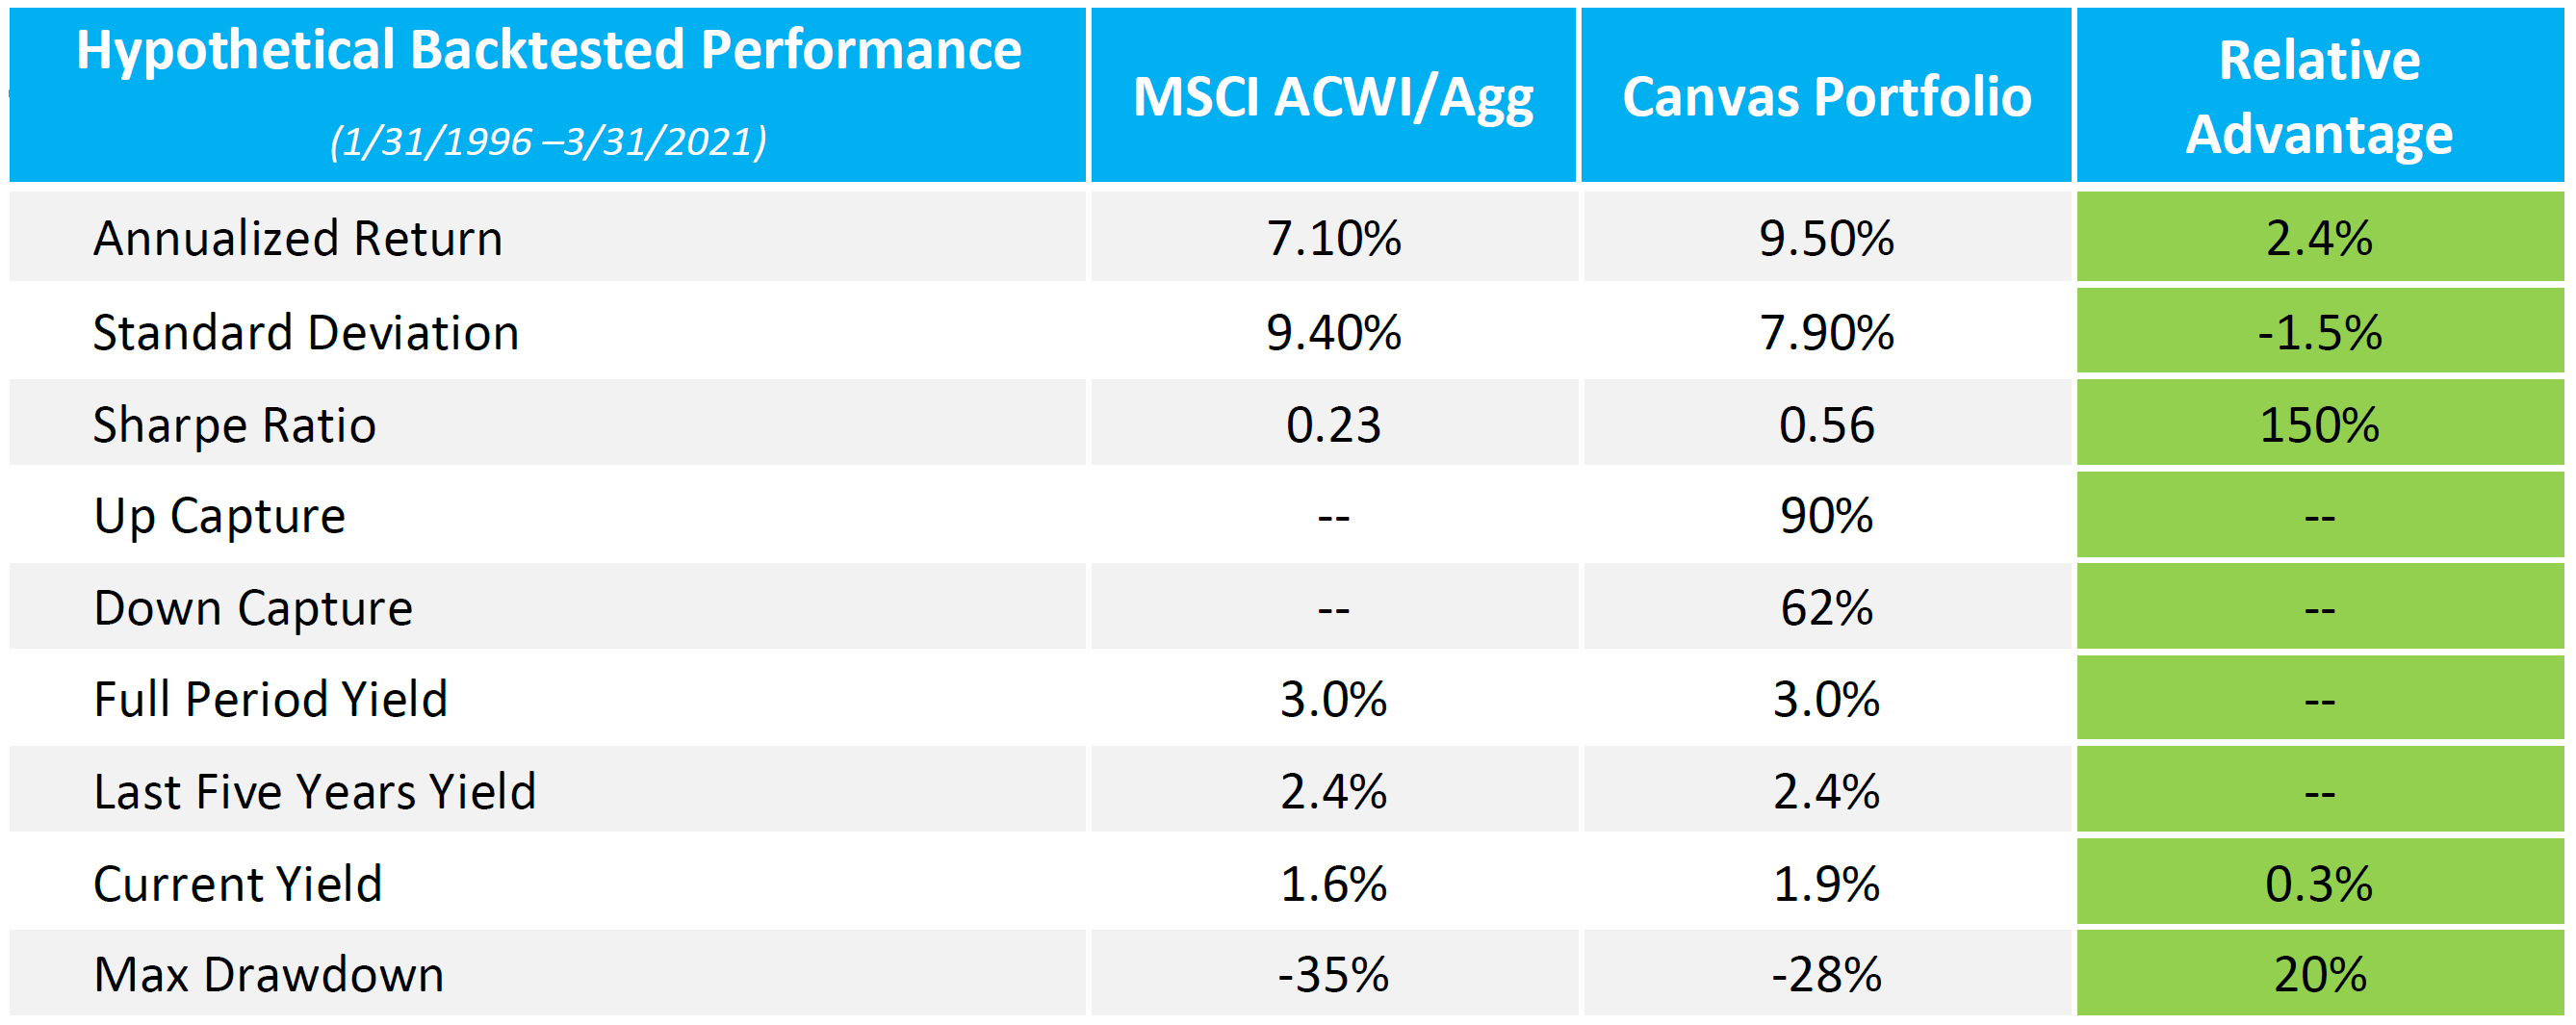
These stats are gross of fees, taxes, and inflation, so in the following sections we look at how the portfolio satisfies the client’s specific objectives for annual income and asset appreciation with those things taken into consideration.
Satisfying the Client’s $100,000 Annual Living Expenses
Does the portfolio meet the client’s “Take Home” requirement: $100,000 in annual distributions while maintaining purchasing power?
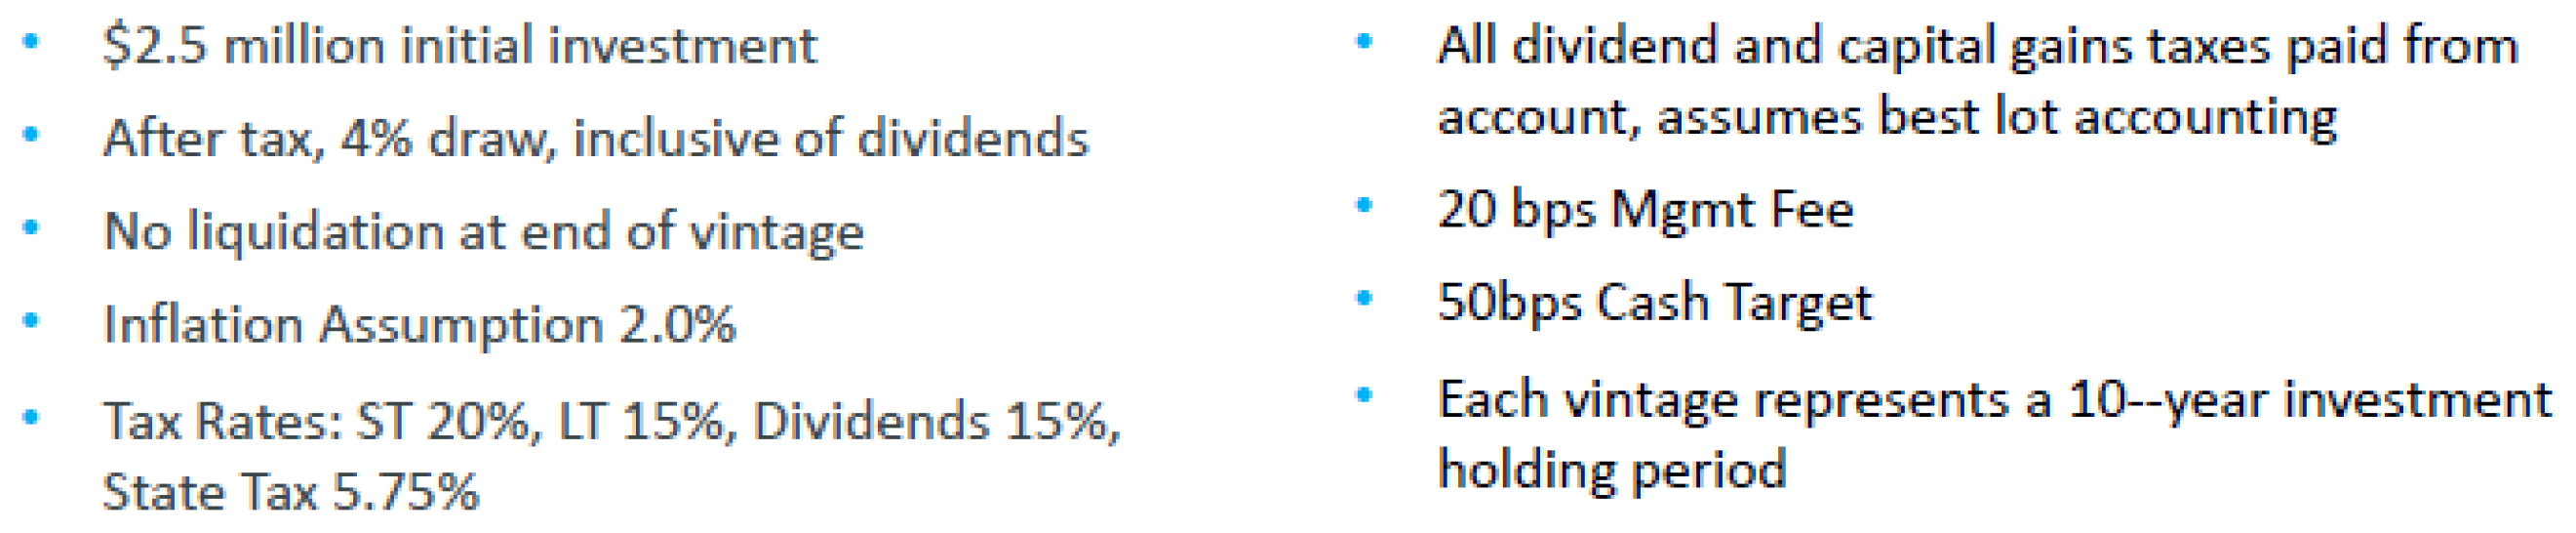
To answer this question, we ran a series of 15 scenarios that attempted to establish a range of potential outcomes for meeting the client’s objectives. We refer to each scenario as a “vintage”, and each vintage runs for a 10-year holding period—i.e., 1996-2005, 1997-2006, 1998-2007, etc. Each scenario is backtested as close to reality as possible. The portfolio is tracked at the tax lot level from inception through the 10-year holding period with taxes, fees, and distributions deducted and accounted for. Based on the client’s direction, we ran the scenarios with a few important parameters:
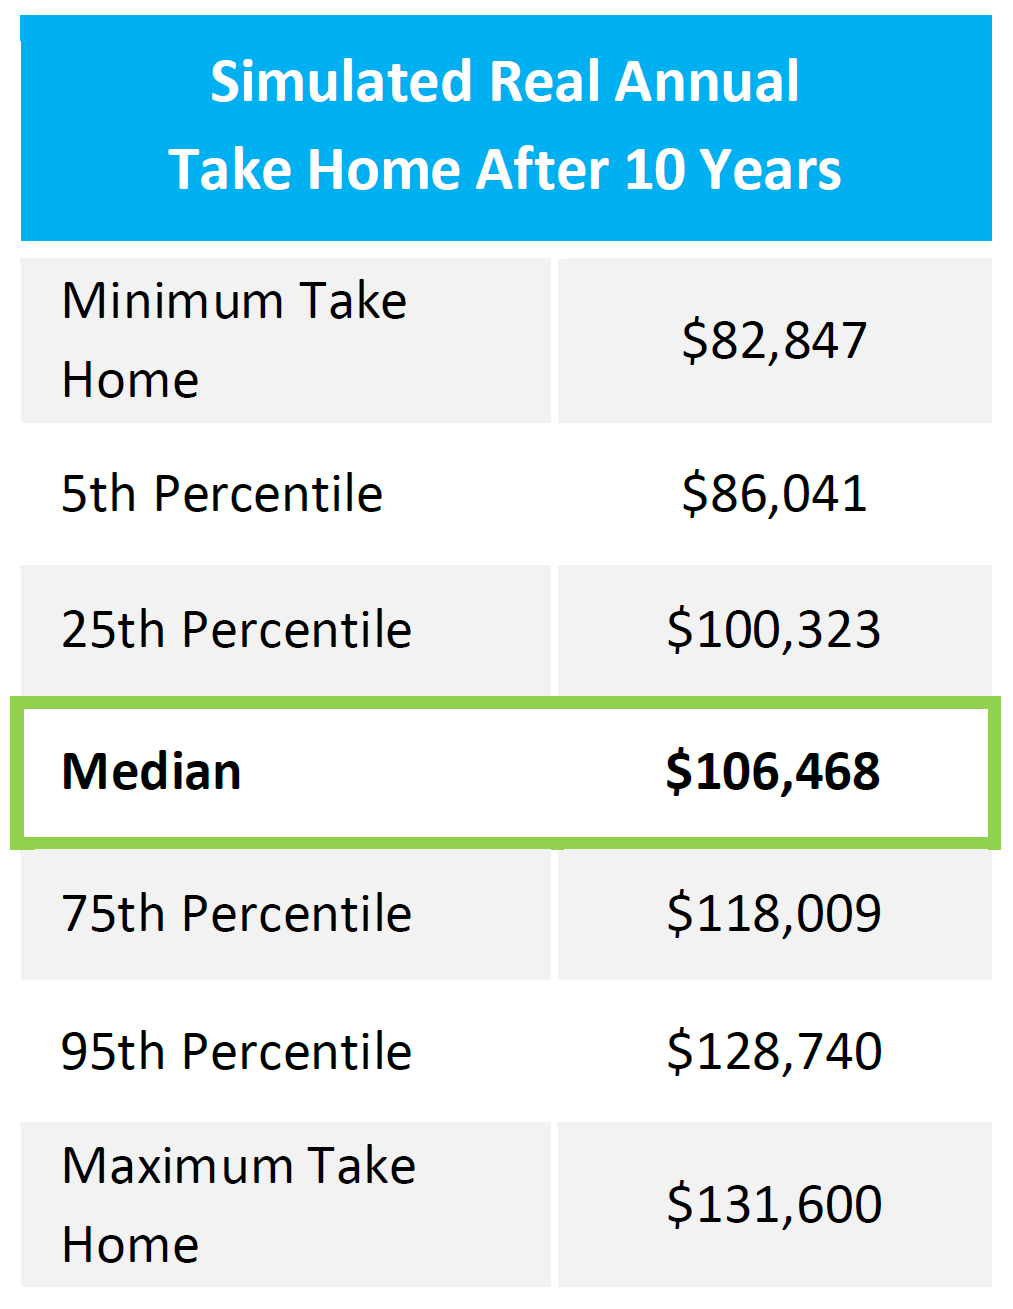
The chart below shows the range of potential income (after fees, taxes, and inflation) on a rolling 12-month “take home” basis across our analysis. We found that in 75% of scenarios, the client’s take home would have met the objective of inflation-adjusted income of at least $100,000. The worst-case scenario was an 18% loss of purchasing power with take home dipping to $82,847 and the most optimistic case was a 31% gain in purchasing power to a take home of $131,600. The base, or “median” case was a 6% increase to $106,468.
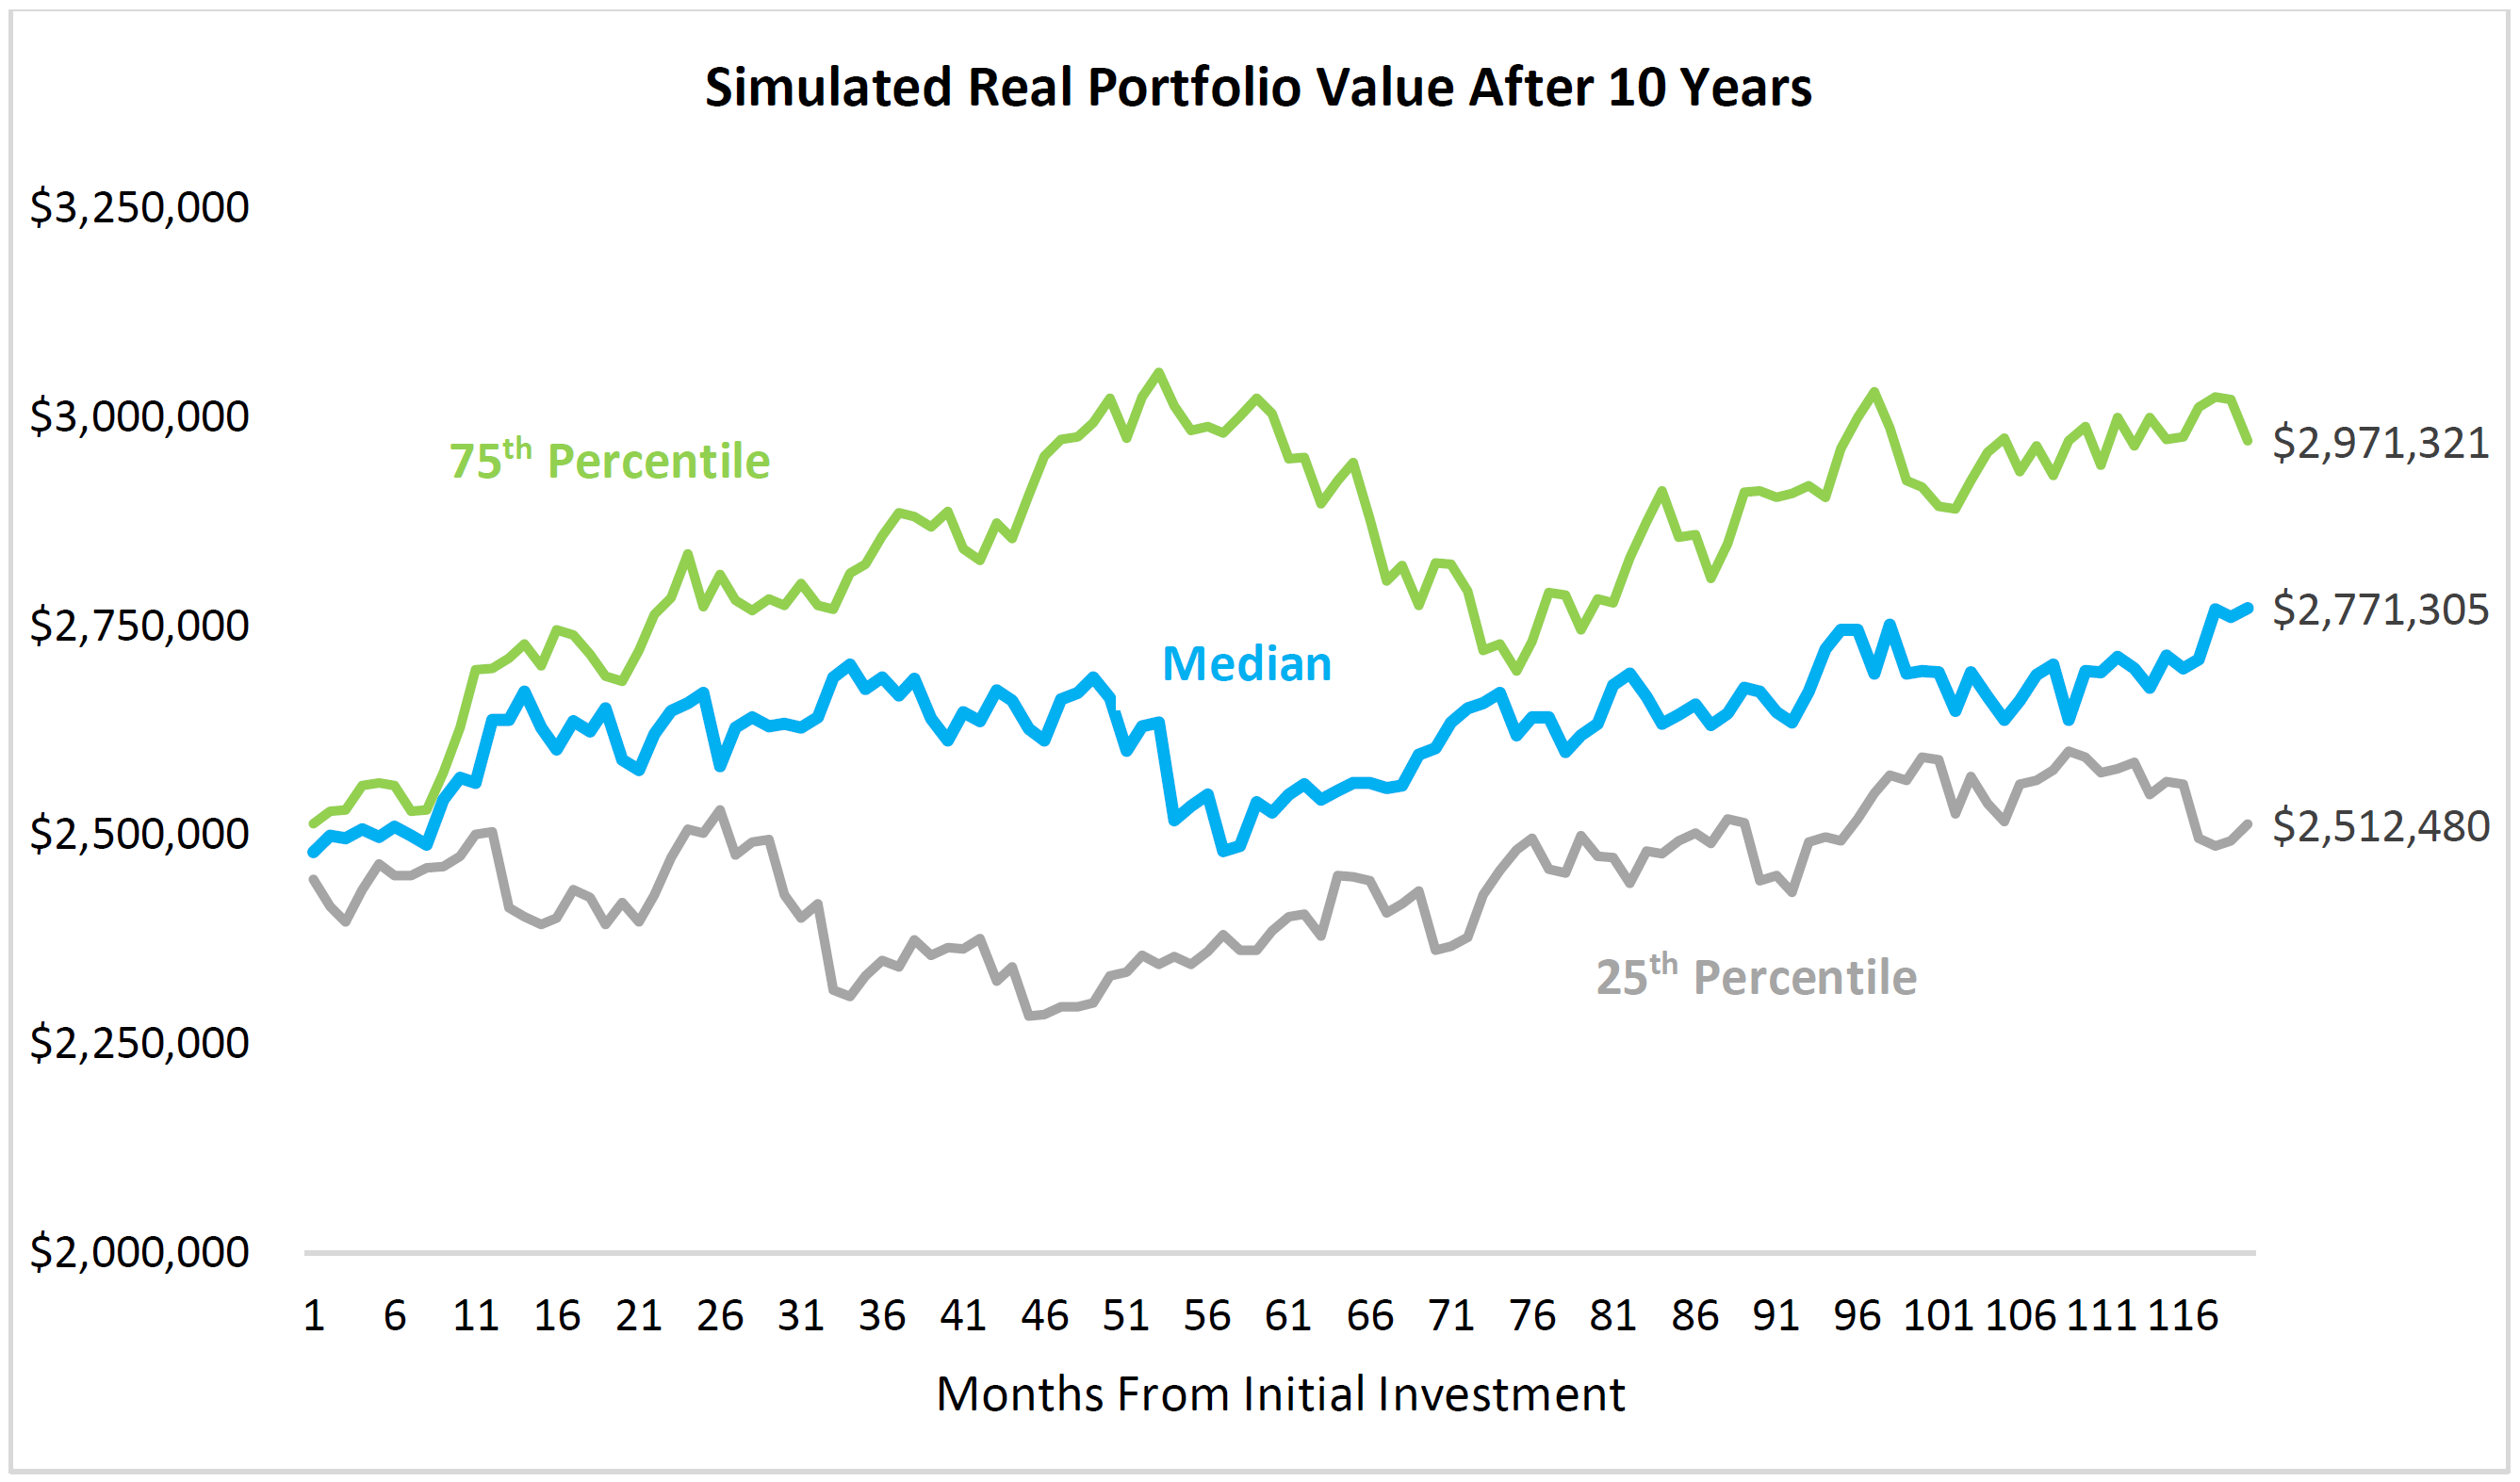
Protecting Principal & Keeping Pace with Inflation
In addition to generating the targeted take home levels, the portfolio was able to generate principal return sufficient to keep pace with inflation in most scenarios—after taxes, fees, and distributions. Below is a simulation for the principal value of the portfolio for the 75th percentile, 25th percentile, and median case over all the simulations. Again, in the 25th percentile case, the portfolio maintains purchasing power net of all fees, taxes, and distributions.
As a further check on the efficacy of the proposed portfolio for meeting this client’s requirements, the data below exhibits the percentage of rolling year-over-year observations where the portfolio value increased. In other words, the percentage of years where the ending portfolio value was higher than the preceding year.
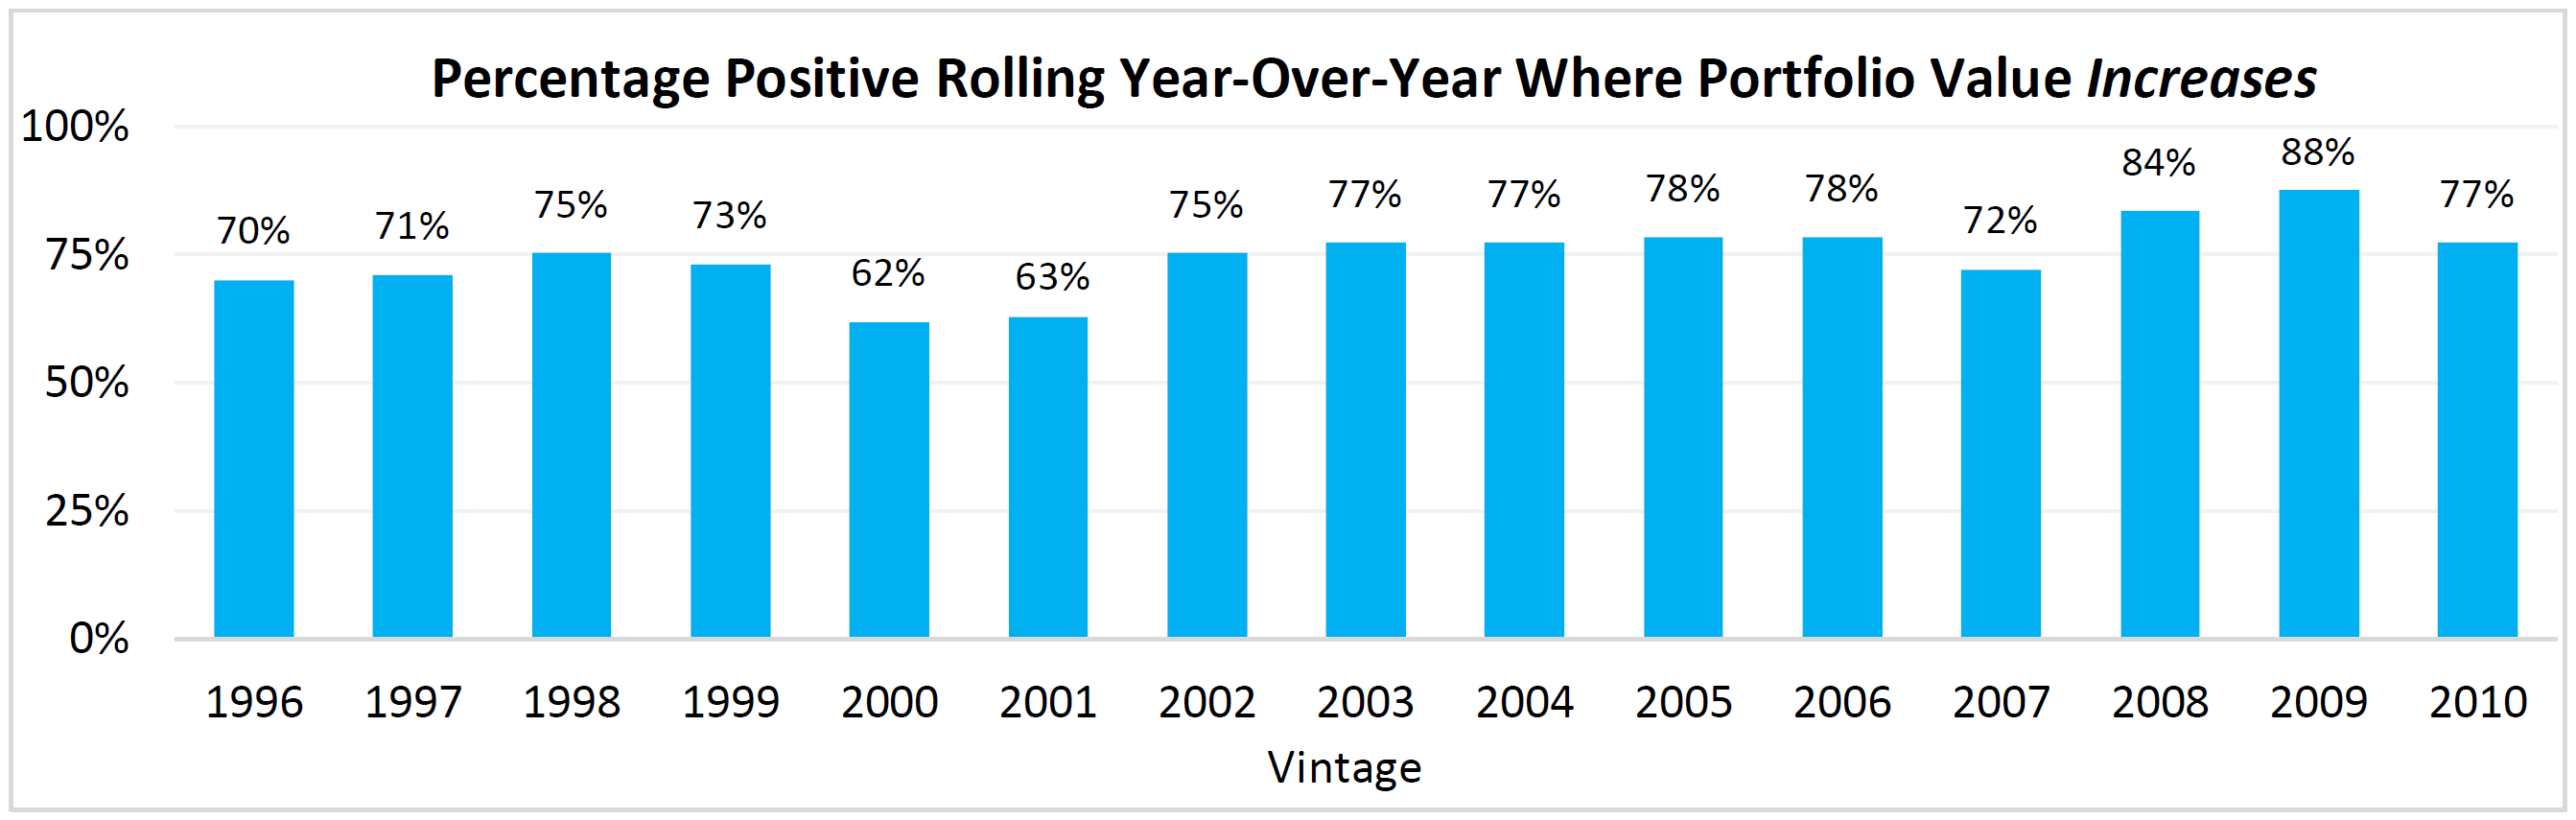
Across the fifteen 10-year periods, the portfolio value increased year-over-year 75% of the time. Between these two simulations, we felt confident that the developed strategy would maintain pace with inflation and maintain its asset level.
Conclusion
This case study is just one example of how the Canvas investment levers can be used to construct strategies that solve for unique situations. In this case, the situation involved meeting specific income and asset appreciation requirements for a retiree. Utilizing a combination of Fixed Income, Factor Alpha, and Defensive Stability, we were able to build a portfolio that generated stable returns that outpaced inflation, provided consistent income, and offered downside protection. For our specific partner, this offered them an optimal retiree portfolio that they could use with existing clients and to help grow their business.
If you or your firm have an investment “problem” that you are looking to solve for, request a Canvas demo today: https://canvas.osam.com/
Please note, the term “partner” is not meant to give rise to a legal relationship other than the sub-advisory one that exists contractually between OSAM and the primary investment professional who manages the client’s portfolio through the Canvas® platform.
GENERAL LEGAL DISCLOSURES & HYPOTHETICAL AND/OR BACKTESTED RESULTS DISCLAIMER
The material contained herein is intended as a general market commentary. Opinions expressed herein are solely those of O’Shaughnessy Asset Management, LLC and may differ from those of your broker or investment firm.
Please remember that past performance may not be indicative of future results. Different types of investments involve varying degrees of risk, and there can be no assurance that the future performance of any specific investment, investment strategy, or product (including the investments and/or investment strategies recommended or undertaken by O’Shaughnessy Asset Management, LLC), or any non-investment related content, made reference to directly or indirectly in this piece will be profitable, equal any corresponding indicated historical performance level(s), be suitable for your portfolio or individual situation, or prove successful. Due to various factors, including changing market conditions and/or applicable laws, the content may no longer be reflective of current opinions or positions. Moreover, you should not assume that any discussion or information contained in this piece serves as the receipt of, or as a substitute for, personalized investment advice from O’Shaughnessy Asset Management, LLC. Any individual account performance information reflects the reinvestment of dividends (to the extent applicable), and is net of applicable transaction fees, O’Shaughnessy Asset Management, LLC’s investment management fee (if debited directly from the account), and any other related account expenses. Account information has been compiled solely by O’Shaughnessy Asset Management, LLC, has not been independently verified, and does not reflect the impact of taxes on non-qualified accounts. In preparing this report, O’Shaughnessy Asset Management, LLC has relied upon information provided by the account custodian. Please defer to formal tax documents received from the account custodian for cost basis and tax reporting purposes. Please remember to contact O’Shaughnessy Asset Management, LLC, in writing, if there are any changes in your personal/financial situation or investment objectives for the purpose of reviewing/evaluating/revising our previous recommendations and/or services, or if you want to impose, add, or modify any reasonable restrictions to our investment advisory services. Please Note: Unless you advise, in writing, to the contrary, we will assume that there are no restrictions on our services, other than to manage the account in accordance with your designated investment objective. Please Also Note: Please compare this statement with account statements received from the account custodian. The account custodian does not verify the accuracy of the advisory fee calculation. Please advise us if you have not been receiving monthly statements from the account custodian. Historical performance results for investment indices and/or categories have been provided for general comparison purposes only, and generally do not reflect the deduction of transaction and/or custodial charges, the deduction of an investment management fee, nor the impact of taxes, the incurrence of which would have the effect of decreasing historical performance results. It should not be assumed that your account holdings correspond directly to any comparative indices. To the extent that a reader has any questions regarding the applicability of any specific issue discussed above to his/her individual situation, he/she is encouraged to consult with the professional advisor of his/her choosing. O’Shaughnessy Asset Management, LLC is neither a law firm nor a certified public accounting firm and no portion of the newsletter content should be construed as legal or accounting advice. A copy of the O’Shaughnessy Asset Management, LLC’s current written disclosure statement discussing our advisory services and fees is available upon request.
The risk-free rate used in the calculation of Sortino, Sharpe, and Treynor ratios is 5%, consistently applied across time.
The universe of All Stocks consists of all securities in the Chicago Research in Security Prices (CRSP) dataset or S&P Compustat Database (or other, as noted) with inflation-adjusted market capitalization greater than $200 million as of most recent year-end. The universe of Large Stocks consists of all securities in the Chicago Research in Security Prices (CRSP) dataset or S&P Compustat Database (or other, as noted) with inflation-adjusted market capitalization greater than the universe average as of most recent year-end. The stocks are equally weighted and generally rebalanced annually.
Hypothetical performance results shown on the preceding pages are backtested and do not represent the performance of any account managed by OSAM, but were achieved by means of the retroactive application of each of the previously referenced models, certain aspects of which may have been designed with the benefit of hindsight.
The hypothetical backtested performance does not represent the results of actual trading using client assets nor decision-making during the period and does not and is not intended to indicate the past performance or future performance of any account or investment strategy managed by OSAM. If actual accounts had been managed throughout the period, ongoing research might have resulted in changes to the strategy which might have altered returns. The performance of any account or investment strategy managed by OSAM will differ from the hypothetical backtested performance results for each factor shown herein for a number of reasons, including without limitation the following:
- Although OSAM may consider from time to time one or more of the factors noted herein in managing any account, it may not consider all or any of such factors. OSAM may (and will) from time to time consider factors in addition to those noted herein in managing any account.
- OSAM may rebalance an account more frequently or less frequently than annually and at times other than presented herein.
- OSAM may from time to time manage an account by using non-quantitative, subjective investment management methodologies in conjunction with the application of factors.
- The hypothetical backtested performance results assume full investment, whereas an account managed by OSAM may have a positive cash position upon rebalance. Had the hypothetical backtested performance results included a positive cash position, the results would have been different and generally would have been lower.
- The hypothetical backtested performance results for each factor do not reflect any transaction costs of buying and selling securities, investment management fees (including without limitation management fees and performance fees), custody and other costs, or taxes – all of which would be incurred by an investor in any account managed by OSAM. If such costs and fees were reflected, the hypothetical backtested performance results would be lower.
- The hypothetical performance does not reflect the reinvestment of dividends and distributions therefrom, interest, capital gains and withholding taxes.
- Accounts managed by OSAM are subject to additions and redemptions of assets under management, which may positively or negatively affect performance depending generally upon the timing of such events in relation to the market’s direction.
- Simulated returns may be dependent on the market and economic conditions that existed during the period. Future market or economic conditions can adversely affect the returns.
Please Note: Socially Responsible Investing Limitations. Socially Responsible Investing involves the incorporation of Environmental, Social and Governance considerations into the investment due diligence process (“ESG). There are potential limitations associated with allocating a portion of an investment portfolio in ESG securities (i.e., securities that have a mandate to avoid, when possible, investments in such products as alcohol, tobacco, firearms, oil drilling, gambling, etc.). The number of these securities may be limited when compared to those that do not maintain such a mandate. ESG securities could underperform broad market indices. Investors must accept these limitations, including potential for underperformance. Correspondingly, the number of ESG mutual funds and exchange traded funds are few when compared to those that do not maintain such a mandate. As with any type of investment (including any investment and/or investment strategies recommended and/or undertaken by OSAM), there can be no assurance that investment in ESG securities or funds will be profitable, or prove successful.


