Investing in Social Justice
By OSAM Research Team
March 2021
Social Justice 2020
The social justice movement took center stage in 2020 following the deaths of Breonna Taylor, George Floyd, and others. These tragic events sparked a global focus on social justice and reignited conversations around racism, inequality, and reform.
Amidst this movement, we received requests related to integrating these social matters into the investment process. Investing is one small but important medium for promoting change as it enables investors to vote on material issues and align their values with their wallet. Last July, we developed a model with a Canvas partner that invests in companies committed to diversity, equity, and inclusion (DEI) in the workplace. This portfolio has provided the firm’s advisors with a values-based portfolio offering strong fundamentals for clients and prospects that are passionate about social justice and equality.
Building a social justice model
ESG focused portfolios are typically built using three core levers, and we walk through the process below:
1) Exclusions
2) Tilts
3) Active Ownership
The Social Justice model incorporates all three: overweighting companies with strong equal rights, equal opportunity, and equal treatment values; pushing poor scoring companies to change through proxy voting; and completely divesting when misalignment in values is too large.
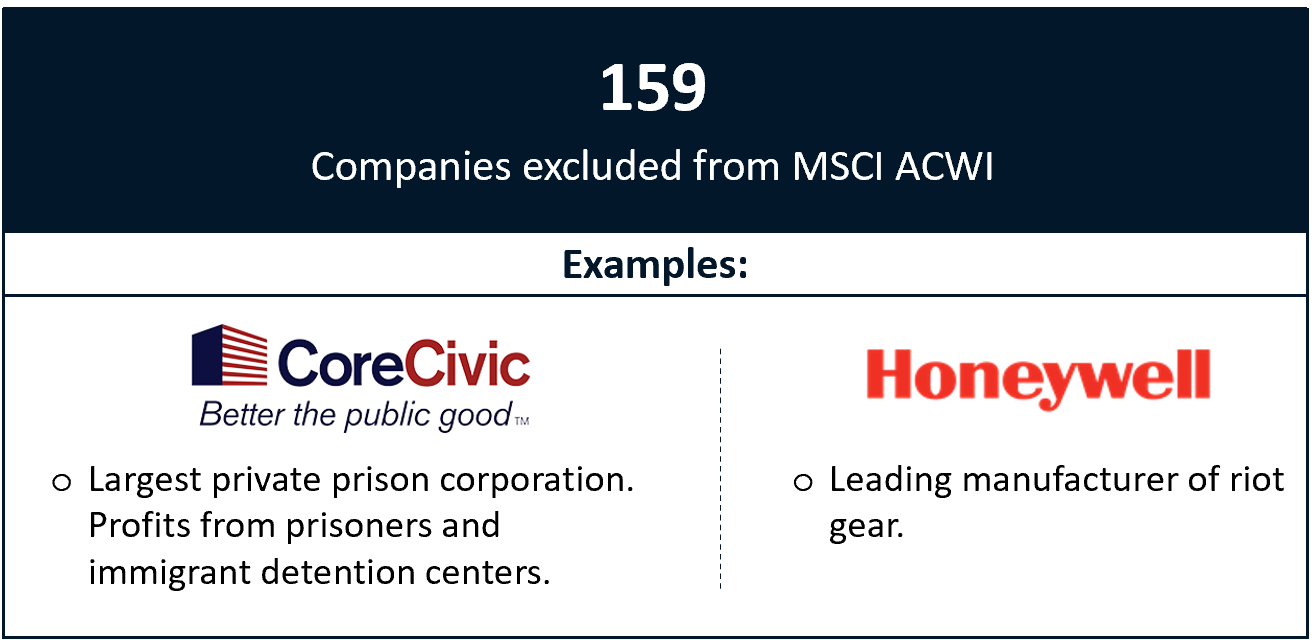
Exclusions: The Social Justice model excludes companies with ties to businesses that disproportionately impact communities of color: private prisons, predatory lending, and the militarization of police (riot gear). It also divests from companies involved in any severe diversity or labor related controversies.
Tilts: After these exclusions, we “score” our investible universe on social justice metrics and overweight stronger-scoring companies while underweighting and/or removing lower-scoring ones. We use proprietary data, our ESG scoring convention, and our risk-optimization engine to score and construct ESG portfolios. Our social justice scoring framework incorporates the themes below:
1) Board Diversity
2) Discrimination Policies
3) Racial and Ethnic Diversity Programs
4) Freedom of Association Policies
5) Supply Chain Monitoring for Racial and Ethnic Diversity
6) Community Development Programs in Minority Communities
7) Minority-Inclusive Health Care Access and/or Medical Research and Development
8) Human Rights Issues like Conflict Minerals Programs and No Ties to Forced Labor
9) Financial Inclusion Policies

After completely removing the lowest scoring “social justice” companies, we increased the social justice score of the highest scoring quintile of companies by 19.4% and decreased the lowest scoring quintile of companies by 17.9% – all while maintaining the efficacy of the underlying investment model.1 Advisors have the flexibility to increase/decrease the “tilt level” to control for tracking error.
Active Ownership: Owning public equities provides the opportunity to vote on shareholder issues. Adding socially responsible proxy voting allows for an active ownership approach to further influence portfolio companies. Specific to the Social Justice model, we proxy vote in a way that promotes more diversity in board rooms and additional transparency on diversity initiatives and data points like pay gap metrics.
Returns & Risk
In addition to maximizing exposure to companies most aligned with social justice values, the advisor wanted return characteristics to closely match their firms high-conviction investment model. In other words, they wanted to significantly improve the pro-social justice exposure in the new model while maintaining the efficacy of the legacy investment model. We strive to be the platform where advisors can offer custom, values-based portfolios with unrivaled specificity – in this case, controlling for tracking error to marry risk-adjusted return and values-based goals.
Encourage your clients to make it their own
Just as there is no single way to promote social justice, there is no single definition of social justice investing. We believe values-based investing is never one-size-fits-all and is better accomplished through a separately managed account platform like Canvas. For advisors interested in DEI, within Canvas you can access this model, build a variation of it, or create something entirely new. Beyond DEI, our mission is to precisely match unique values and investment objectives.
If you are an advisor and have an ESG model or mandate in mind, we would love to talk: esg@osam.com.
Footnotes:
1 As of December 2020.
GENERAL LEGAL DISCLOSURES & HYPOTHETICAL AND/OR BACKTESTED RESULTS DISCLAIMER
The material contained herein is intended as a general market commentary. Opinions expressed herein are solely those of O’Shaughnessy Asset Management, LLC and may differ from those of your broker or investment firm.
Please remember that past performance may not be indicative of future results. Different types of investments involve varying degrees of risk, and there can be no assurance that the future performance of any specific investment, investment strategy, or product (including the investments and/or investment strategies recommended or undertaken by O’Shaughnessy Asset Management, LLC), or any non-investment related content, made reference to directly or indirectly in this piece will be profitable, equal any corresponding indicated historical performance level(s), be suitable for your portfolio or individual situation, or prove successful. Due to various factors, including changing market conditions and/or applicable laws, the content may no longer be reflective of current opinions or positions. Moreover, you should not assume that any discussion or information contained in this piece serves as the receipt of, or as a substitute for, personalized investment advice from O’Shaughnessy Asset Management, LLC. Any individual account performance information reflects the reinvestment of dividends (to the extent applicable), and is net of applicable transaction fees, O’Shaughnessy Asset Management, LLC’s investment management fee (if debited directly from the account), and any other related account expenses. Account information has been compiled solely by O’Shaughnessy Asset Management, LLC, has not been independently verified, and does not reflect the impact of taxes on non-qualified accounts. In preparing this report, O’Shaughnessy Asset Management, LLC has relied upon information provided by the account custodian. Please defer to formal tax documents received from the account custodian for cost basis and tax reporting purposes. Please remember to contact O’Shaughnessy Asset Management, LLC, in writing, if there are any changes in your personal/financial situation or investment objectives for the purpose of reviewing/evaluating/revising our previous recommendations and/or services, or if you want to impose, add, or modify any reasonable restrictions to our investment advisory services. Please Note: Unless you advise, in writing, to the contrary, we will assume that there are no restrictions on our services, other than to manage the account in accordance with your designated investment objective. Please Also Note: Please compare this statement with account statements received from the account custodian. The account custodian does not verify the accuracy of the advisory fee calculation. Please advise us if you have not been receiving monthly statements from the account custodian. Historical performance results for investment indices and/or categories have been provided for general comparison purposes only, and generally do not reflect the deduction of transaction and/or custodial charges, the deduction of an investment management fee, nor the impact of taxes, the incurrence of which would have the effect of decreasing historical performance results. It should not be assumed that your account holdings correspond directly to any comparative indices. To the extent that a reader has any questions regarding the applicability of any specific issue discussed above to his/her individual situation, he/she is encouraged to consult with the professional advisor of his/her choosing. O’Shaughnessy Asset Management, LLC is neither a law firm nor a certified public accounting firm and no portion of the newsletter content should be construed as legal or accounting advice. A copy of the O’Shaughnessy Asset Management, LLC’s current written disclosure statement discussing our advisory services and fees is available upon request
The risk-free rate used in the calculation of Sortino, Sharpe, and Treynor ratios is 5%, consistently applied across time
The universe of All Stocks consists of all securities in the Chicago Research in Security Prices (CRSP) dataset or S&P Compustat Database (or other, as noted) with inflation-adjusted market capitalization greater than $200 million as of most recent year-end. The universe of Large Stocks consists of all securities in the Chicago Research in Security Prices (CRSP) dataset or S&P Compustat Database (or other, as noted) with inflation-adjusted market capitalization greater than the universe average as of most recent year-end. The stocks are equally weighted and generally rebalanced annually
Hypothetical performance results shown on the preceding pages are backtested and do not represent the performance of any account managed by OSAM, but were achieved by means of the retroactive application of each of the previously referenced models, certain aspects of which may have been designed with the benefit of hindsight
The hypothetical backtested performance does not represent the results of actual trading using client assets nor decision-making during the period and does not and is not intended to indicate the past performance or future performance of any account or investment strategy managed by OSAM. If actual accounts had been managed throughout the period, ongoing research might have resulted in changes to the strategy which might have altered returns. The performance of any account or investment strategy managed by OSAM will differ from the hypothetical backtested performance results for each factor shown herein for a number of reasons, including without limitation the following:
- Although OSAM may consider from time to time one or more of the factors noted herein in managing any account, it may not consider all or any of such factors. OSAM may (and will) from time to time consider factors in addition to those noted herein in managing any account.
- OSAM may rebalance an account more frequently or less frequently than annually and at times other than presented herein.
- OSAM may from time to time manage an account by using non-quantitative, subjective investment management methodologies in conjunction with the application of factors.
- The hypothetical backtested performance results assume full investment, whereas an account managed by OSAM may have a positive cash position upon rebalance. Had the hypothetical backtested performance results included a positive cash position, the results would have been different and generally would have been lower.
- The hypothetical backtested performance results for each factor do not reflect any transaction costs of buying and selling securities, investment management fees (including without limitation management fees and performance fees), custody and other costs, or taxes – all of which would be incurred by an investor in any account managed by OSAM. If such costs and fees were reflected, the hypothetical backtested performance results would be lower.
- The hypothetical performance does not reflect the reinvestment of dividends and distributions therefrom, interest, capital gains and withholding taxes.
- Accounts managed by OSAM are subject to additions and redemptions of assets under management, which may positively or negatively affect performance depending generally upon the timing of such events in relation to the market’s direction.
- Simulated returns may be dependent on the market and economic conditions that existed during the period. Future market or economic conditions can adversely affect the returns.


