High Conviction Buybacks
By Patrick O’Shaughnessy
August 2015
Money spent on share buybacks is approaching the previous high set in 2007–08, and this has some investors worried. But hidden beneath the aggregate statistics on buybacks are important nuances that matter for investors. Firms repurchase shares at different levels of conviction and that level of conviction can help differentiate between an attractive investment opportunity and useless information.
Most of the dollars spent on buybacks come from what we classify as low conviction share repurchase programs: firms repurchasing between zero and five percent of their shares over the past year. More interesting are firms that vote more aggressively—for better or worse—on their own share price, repurchasing more than five percent and sometimes even greater than ten percent of their shares in just a one-year period. History suggests that these high conviction firms signal an opportunity for investors.
A common criticism levied against buybacks is that corporate managers mistime their repurchases, buying back stock at expensive prices. But this hasn’t been true for the high conviction buyback firms. Since 1987, roughly half of all high conviction buybacks conducted by large U.S. firms were conducted when the firm’s stock was in the cheapest quintile of all large stocks; fewer than ten percent of high conviction buyback firms bought back shares when they were in the most expensive quintile of the market. The same numbers for low conviction firms? Only 28 percent bought back shares while their stock was in the cheapest quintile and roughly 20 percent bought back shares in the most expensive quintile. There is a clear historical relationship between buyback conviction and cheapness.
Even more important for investors, these high conviction buyback stocks have outperformed the market consistently through time.
This paper explores the current buyback landscape for U.S. stocks and highlights the potential edge given to those who invest alongside high conviction buyback firms.
Conviction Matters
Sure enough, we are reaching peak dollar amounts on a rolling 12-month basis. But these are just raw dollars being spent—it doesn’t tell us much about the magnitude of the buyback programs going on, which is a crucial detail.
A firm that repurchases ten percent of its shares in one year is much different than a firm that repurchases two percent. To put it another way, if Apple ($740 billion market cap) spends one billion dollars on repurchases, it’s much different than if Marathon Petroleum ($30 billion market cap) spends a billion dollars. Arguably, the billion spent by Marathon would represent a higher conviction in their own share price by Marathon’s executives. They would be making a much bigger bet.
Total cash spent on buybacks based on buyback conviction level can be separated into groups: the low conviction group has repurchased between zero and five percent of their shares in the past year, the higher conviction group has repurchased between five and ten percent of their shares, and the highest conviction group has repurchased more than ten percent of their shares. When you add up the totals, it becomes clear that most of the raw dollars being spent on buybacks come from the low conviction group. Figure 1 shows all firms with a positive net buyback over the past year and breaks out the total amount of cash coming from all three levels of buyback conviction at each point in time, which add up to the market’s overall buyback amount (black line).
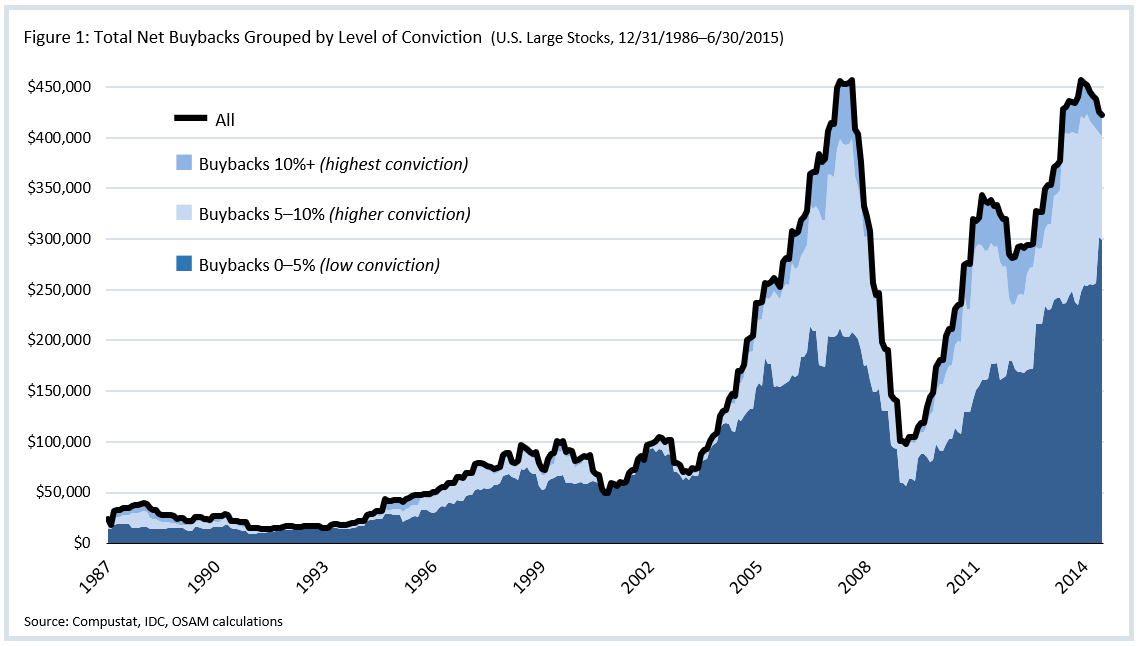
From the chart above, we glean our first key observation: currently, the cash being spent on buybacks by the low conviction firms is about 70 percent of the total amount spent, which is very close to the long-term average (67 percent). Most of the remaining 30 percent comes from firms buying back between five and ten percent of their shares. A small fraction comes from firms with very high conviction, buying back more than ten percent of their shares. Again, these current numbers are consistent across the time period.
Buyback Timing
Do firms with higher conviction share buyback programs do a good job of buying low? To answer this question, we measure the relative valuations when firms have tended to repurchase shares at varying levels of buyback conviction.
The firms are evaluated and compared to all other large U.S. stocks on each date, resulting in a percentile score from zero to one hundred (zero is cheapest). We use four factors to measure valuation: price-to-sales, price-to-earnings, free cash flow-to-enterprise value, and EBITDA-to-enterprise value. The factors are equally weighted in the calculation, giving us a diversified measure of cheapness.
Armed with these two things—buyback yield buckets and relative valuation percentiles—we can see if firms tend to buy back shares at cheap or expensive relative prices.
Across a time series going back to 1987, Figure 2 shows the average valuation percentile at the time when firms in the different groups have repurchased shares (as stated earlier, lower means cheaper—the average large stock scores 50 out of 100).
There are two things to note for this chart. First, for contrast, another group is included here: all firms who have been net issuers of shares (diluted existing shareholders through secondary offerings). It is evident that, on average, this group issues shares at higher relative prices. Second, to enhance legibility, higher conviction buybacks (5–10%) and highest conviction buybacks (greater than 10%, which are fairly rare) are consolidated into a single group.
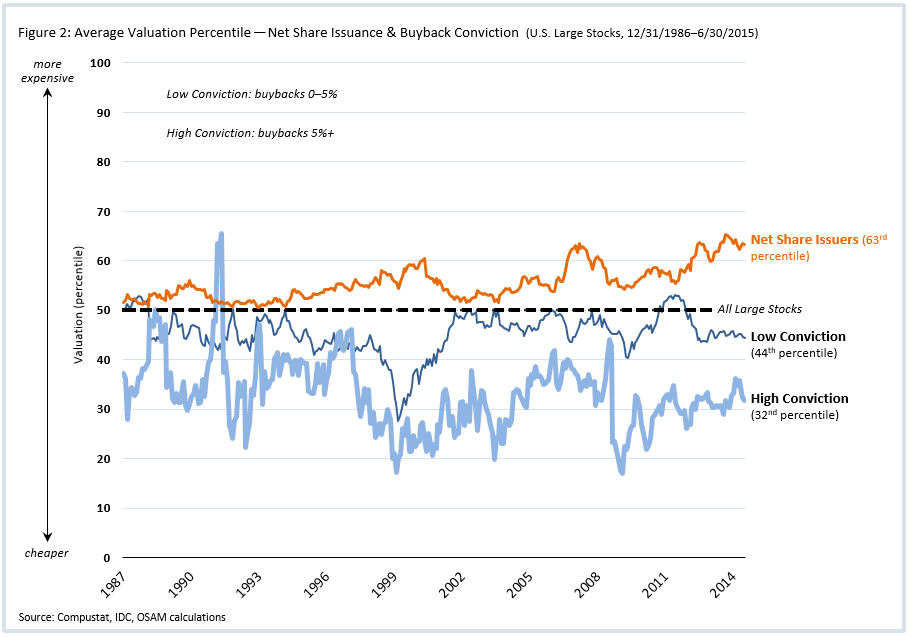
While the low conviction buyback firms have bought back shares cheaper than the market on average (44th valuation percentile across this sample), the high conviction programs tend to repurchase at much cheaper prices (32nd valuation percentile, on average). High conviction buyback programs, on average, are conducted at cheaper relative prices.
One Level Deeper
The historical averages offer some perspective, but going a little deeper and examining the distribution within these groups helps reveal the percentage of firms in the different buckets that are buying at cheap prices versus expensive prices.
To see how the distributions look historically, Figure 3 (on the following page) compares the distribution of all large stocks by valuation percentile versus net share issuers (negative buyback yield firms, issuing more shares than they are buying back).
In Figures 3–4, the valuation percentile buckets are on the horizontal axis and the percentage of firms that fall into each bucket is on the vertical axis. For example, firms that issue shares while their stock prices are in the cheapest five percent of the market fall into the category on the far left (the 0–5 bucket).
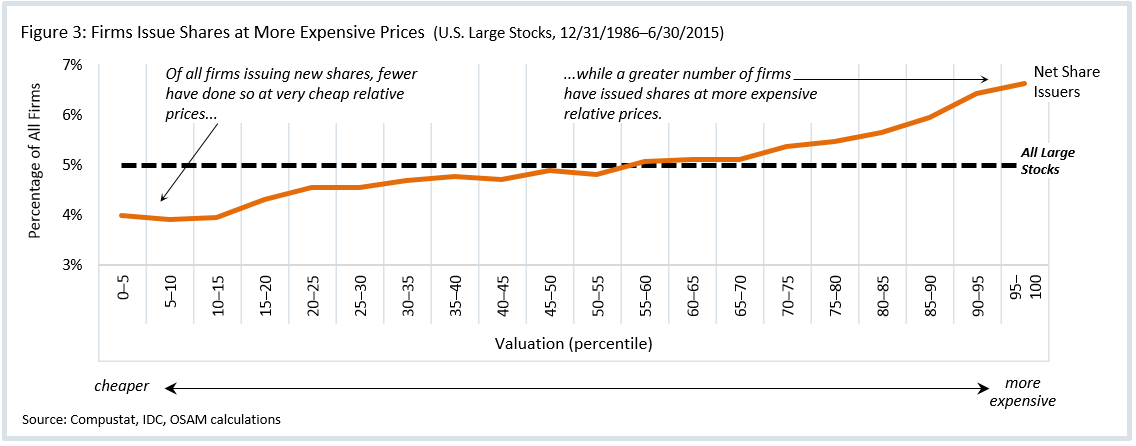
As one might suspect, the line for large stocks is flat—its relative value score is equally distributed in the percentiles from zero to 100. But the result for net share issuers is different. Figure 3 shows that, on average, those firms have tended to be slightly more expensive than other stocks in the market (illustrated by the skew towards the right side of the distribution). This syncs up with the average in Figure 2 on the preceding page.
Now let’s look at the distribution among varying levels of buyback conviction:
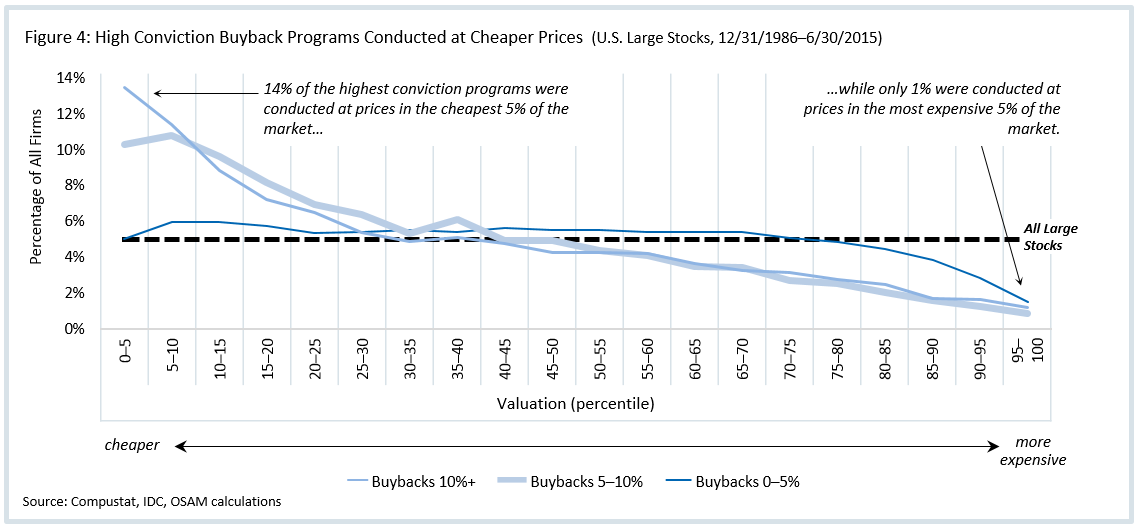
In Figure 4, the trend is reversed: firms in the high conviction groups (5–10% and 10%+ buybacks) have, on average, bought back shares at much cheaper relative prices. In fact, as shown in Figure 2 on the preceding page, their stocks are in the cheapest third of the market by valuation percentile (32nd percentile, on average). There are examples of firms buying back a high percentage of their shares at expensive relative prices, but it has been rare.
Firms with low conviction buyback programs, buying back between zero and five percent of their shares, don’t display nearly as strong a pattern—there isn’t the same big tendency to buy back at cheap prices.
Buybacks may not be well timed in aggregate, but they have been timed well (at least, timed at cheaper relative prices) by firms with high conviction buyback programs. These firms can get lost in the shuffle because, on average, the cash spent on buybacks by these high conviction firms represent a minority of the total cash being spent on buybacks.
Performance
This brings us to the key question: Is this actionable information? That is, do these high conviction firms perform better than the market? Let’s look at some more granular performance data for the different categories. These results are based on a portfolio that includes all stocks in each category, equally weighted at the time of purchase and held for one year.1
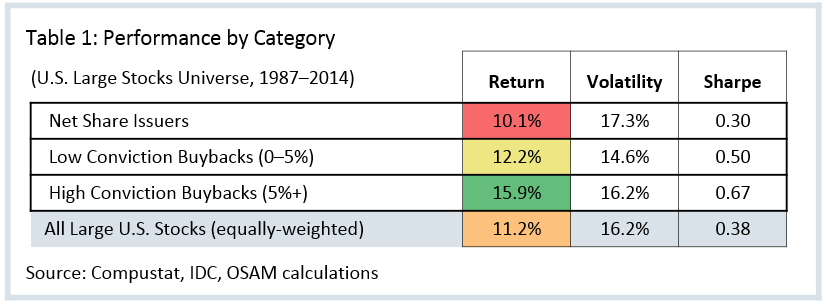
In Table 1, the high conviction firms have delivered significantly better results. Importantly, they have also delivered much more consistent results. Table 2 shows the percent of rolling periods (one-year through ten-year) in which the different categories have outperformed versus an equally-weighted benchmark of large U.S. stocks:
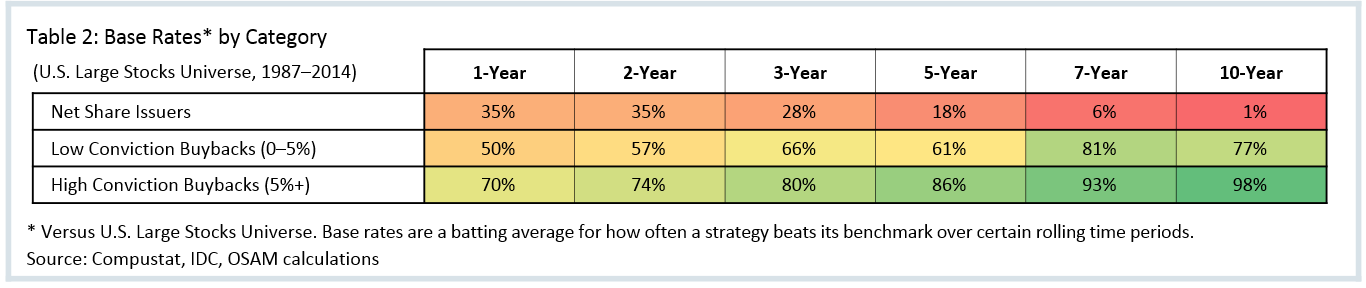
When evaluated through the lens of absolute excess return, risk-adjusted return, and consistency of return, the high conviction buyback firms do quite well.
Building a Strategy to Take Advantage of High Conviction Buybacks
Because buybacks have become such an important tool for returning capital to shareholders in the U.S., we believe that, when measuring “yield,” buybacks must be included alongside dividends. This combination, which we call shareholder yield, is the best way to identify firms committed to returning large amounts of cash to shareholders. Currently, buybacks dominate the highest shareholder yields. Indeed, among the top 50 large U.S. stocks ranked by shareholder yield, the average firm has repurchased eight percent of its shares in the past year. Historically, a strategy that simply selects the ten percent of U.S. stocks with the highest current shareholder yield, rebalanced on a rolling annual basis, has outperformed an equally-weighted large stock universe by 3.7 percent per year since 1963.2
Despite its compelling historical performance, we believe that shareholder yield is best used in combination with other factors. Specifically, cheaper valuations and higher quality should be favored over more expensive valuations and lower quality. The combination of these themes has led to impressive livetime results. As an example, the O’Shaughnessy Market Leaders ValueTM strategy, which screens for quality and valuation before buying stocks with the highest shareholder yields, has outperformed the Russell 1000® Value by 4.8 percent annualized since 2001 (gross of fees, as of 7/31/2015) and has beaten its benchmark in 97 percent of rolling three-year periods and 99 percent of rolling five-year periods by an average annual excess return of 4.9 percent and 5.4 percent, respectively (gross of fees, 12/1/2001–7/31/2015).
CONCLUSION
The common criticism of share buybacks is that they are myopic and mistimed and that the money should be allocated toward capital expenditures and research rather than toward boosting short-term stock prices. At the broad market level—and also for many individual firms—this may be true. Buybacks peaked in 2008 at what turned out to be an inopportune time.
But most of the money spent on buybacks is put forward by firms buying back a fairly low percentage of their shares. On the other hand, firms with high conviction have tended to buy back shares at much cheaper relative valuations than others. In turn, these high conviction firms have gone on to outperform the broader market by large margins, on average, and have done so consistently since 1987.
Whereas peaking buybacks may or may not spell trouble for the market, high conviction buybacks—coupled with quality and attractive valuations—have historically signaled an opportunity.
Footnotes
1 The portfolio is rebalanced on a rolling annual basis, effectively rebalancing one-twelfth of the portfolio each month. This is similar to our methodology for live time trading strategies.
2 Based on returns between 1963–2014.
General Legal Disclosures & Hypothetical and/or Backtested Results Disclaimer
The material contained herein is intended as a general market commentary. Opinions expressed herein are solely those of O’Shaughnessy Asset Management, LLC and may differ from those of your broker or investment firm.
Please remember that past performance may not be indicative of future results. Different types of investments involve varying degrees of risk, and there can be no assurance that the future performance of any specific investment, investment strategy, or product (including the investments and/or investment strategies recommended or undertaken by O’Shaughnessy Asset Management, LLC), or any non-investment related content, made reference to directly or indirectly in this piece will be profitable, equal any corresponding indicated historical performance level(s), be suitable for your portfolio or individual situation, or prove successful. Due to various factors, including changing market conditions and/or applicable laws, the content may no longer be reflective of current opinions or positions. Moreover, you should not assume that any discussion or information contained in this piece serves as the receipt of, or as a substitute for, personalized investment advice from O’Shaughnessy Asset Management, LLC. Any individual account performance information reflects the reinvestment of dividends (to the extent applicable), and is net of applicable transaction fees, O’Shaughnessy Asset Management, LLC’s investment management fee (if debited directly from the account), and any other related account expenses. Account information has been compiled solely by O’Shaughnessy Asset Management, LLC, has not been independently verified, and does not reflect the impact of taxes on non-qualified accounts. In preparing this report, O’Shaughnessy Asset Management, LLC has relied upon information provided by the account custodian. Please defer to formal tax documents received from the account custodian for cost basis and tax reporting purposes. Please remember to contact O’Shaughnessy Asset Management, LLC, in writing, if there are any changes in your personal/financial situation or investment objectives for the purpose of reviewing/evaluating/revising our previous recommendations and/or services, or if you want to impose, add, or modify any reasonable restrictions to our investment advisory services. Please Note: Unless you advise, in writing, to the contrary, we will assume that there are no restrictions on our services, other than to manage the account in accordance with your designated investment objective. Please Also Note: Please compare this statement with account statements received from the account custodian. The account custodian does not verify the accuracy of the advisory fee calculation. Please advise us if you have not been receiving monthly statements from the account custodian. Historical performance results for investment indices and/or categories have been provided for general comparison purposes only, and generally do not reflect the deduction of transaction and/or custodial charges, the deduction of an investment management fee, nor the impact of taxes, the incurrence of which would have the effect of decreasing historical performance results. It should not be assumed that your account holdings correspond directly to any comparative indices. To the extent that a reader has any questions regarding the applicability of any specific issue discussed above to his/her individual situation, he/she is encouraged to consult with the professional advisor of his/her choosing. O’Shaughnessy Asset Management, LLC is neither a law firm nor a certified public accounting firm and no portion of the newsletter content should be construed as legal or accounting advice. A copy of the O’Shaughnessy Asset Management, LLC’s current written disclosure statement discussing our advisory services and fees is available upon request.
Hypothetical performance results shown on the preceding pages are backtested and do not represent the performance of any account managed by OSAM, but were achieved by means of the retroactive application of each of the previously referenced models, certain aspects of which may have been designed with the benefit of hindsight.
The hypothetical backtested performance does not represent the results of actual trading using client assets nor decision-making during the period and does not and is not intended to indicate the past performance or future performance of any account or investment strategy managed by OSAM. If actual accounts had been managed throughout the period, ongoing research might have resulted in changes to the strategy which might have altered returns. The performance of any account or investment strategy managed by OSAM will differ from the hypothetical backtested performance results for each factor shown herein for a number of reasons, including without limitation the following:
▪ Although OSAM may consider from time to time one or more of the factors noted herein in managing any account, it may not consider all or any of such factors. OSAM may (and will) from time to time consider factors in addition to those noted herein in managing any account.
▪ OSAM may rebalance an account more frequently or less frequently than annually and at times other than presented herein.
▪ OSAM may from time to time manage an account by using non-quantitative, subjective investment management methodologies in conjunction with the application of factors.
▪ The hypothetical backtested performance results assume full investment, whereas an account managed by OSAM may have a positive cash position upon rebalance. Had the hypothetical backtested performance results included a positive cash position, the results would have been different and generally would have been lower.
▪ The hypothetical backtested performance results for each factor do not reflect any transaction costs of buying and selling securities, investment management fees (including without limitation management fees and performance fees), custody and other costs, or taxes – all of which would be incurred by an investor in any account managed by OSAM. If such costs and fees were reflected, the hypothetical backtested performance results would be lower.
▪ The hypothetical performance does not reflect the reinvestment of dividends and distributions therefrom, interest, capital gains and withholding taxes.
▪ Accounts managed by OSAM are subject to additions and redemptions of assets under management, which may positively or negatively affect performance depending generally upon the timing of such events in relation to the market’s direction.
▪ Simulated returns may be dependent on the market and economic conditions that existed during the period. Future market or economic conditions can adversely affect the returns.
Composite Performance Summary
For the full composite performance summaries, please follow this link: http://www.osam.com


