Falling Chandeliers & The Evolution of Risk Management (Part 1)
By Jamie Catherwood
October 2021

One of Warren Buffett’s famous investing rules is to win by not losing. In a 1985 PBS appearance the Oracle of Omaha said:
“The first rule on an investment is don’t lose. The second rule on an investment is don’t forget the first rule. That’s all the rules there are.”
As usual, Buffett’s instructions are simple, but not easy. Generally, however, there are two paths for following Buffett’s rules. The first is to only make good investments that never lose money. Alternatively – and more realistically – manage risk through rules and processes that increase your probability of positive outcomes and reduce the odds of meaningful losses.
Few – if any – investors have a 100% hit rate in picking stocks, making the first approach impractical. COVID-19 also showed investors that certain risks just cannot be anticipated and can rock even the steadiest of portfolios. A 19th century edition of the Spectator offers a perfect analogy:
“The profoundest chess-player may see an inevitable mate, and yet, if the chandelier falls upon the pieces, may never win that game.”
As a chess player, how should you prepare for this risk?
1. Ignore this risk and solely focus on executing chess strategies that will defeat your opponent. Accept the odds that falling chandeliers prematurely ending your match are very low.
2. Thoroughly research and study how chandeliers are correctly installed, and meticulously inspect the installation quality of every chandelier that hangs above your chess table.
3. Don’t play chess under chandeliers.
This final option embodies the second approach to Buffett’s instructions outlined earlier: manage risk by implementing rules and processes that increase the probability of positive outcomes by decreasing the chances of negative outcomes. In short, don’t play chess under chandeliers.
For investors, these rules and processes for managing risk may take many forms. In terms of investment strategy, for example, negative screens can be utilized to avoid stocks with traits that historically underperform (lose). This might mean avoiding stocks of companies that are loaded up with debt and have declining earnings growth. While this does not guarantee that all companies “surviving” this filter are great investments, it creates a higher-quality universe of stocks to invest in. In short, probabilities of a positive investment are improved by avoiding stocks with “losing” characteristics.
At the structural level, investors can utilize vehicles that offer better risk management by enabling granular customization and control. For example, implementing rules and processes for risk management is much easier in a Separately Managed Account (SMA) owning individual securities than a “pre-packaged” mutual fund or ETF.
Finally, investors should leverage innovations in technology and data analysis to execute their risk management processes. In the current ‘Age of Information’, this has never been more important. For instance, it is only through advances in data analysis and technology that the screening factors for avoiding low-quality stocks can be implemented. As we will cover later, there have been major innovations on this front that investors should be aware of.
In truth, most financial innovations originated from a desire to avoid losses. History demonstrates that advancements in risk management often stem from these key areas: investment vehicles, investment strategy, and innovations in technology and data analysis.
This three-part series will highlight that we are experiencing a boom in each of these areas, and investors should understand the tools available for managing risk. In doing so, investors can better follow Buffett’s instructions to “win” by “not losing”.
Investment Vehicles: Unlocking New Risk Management Capabilities
In this inaugural post, we will look at the role of investment vehicle innovations for unlocking new risk management capabilities. From diversification through commingled funds to corporate structures limiting liability, investment vehicles provide the underlying structure for investors to execute their risk management processes.
A History Lesson
For merchants in 17th century Europe, financing voyages was extremely expensive and only funded by the small group directly involved in each venture. Consequently, a merchant’s capital was often concentrated in a single voyage. Not exactly “diversified”.
Since merchant voyages often failed, this concentrated exposure was especially risky. The chart below shows that only 49 (53%) of 92 Dutch East India Company voyages between 1602-1612 returned safely.1
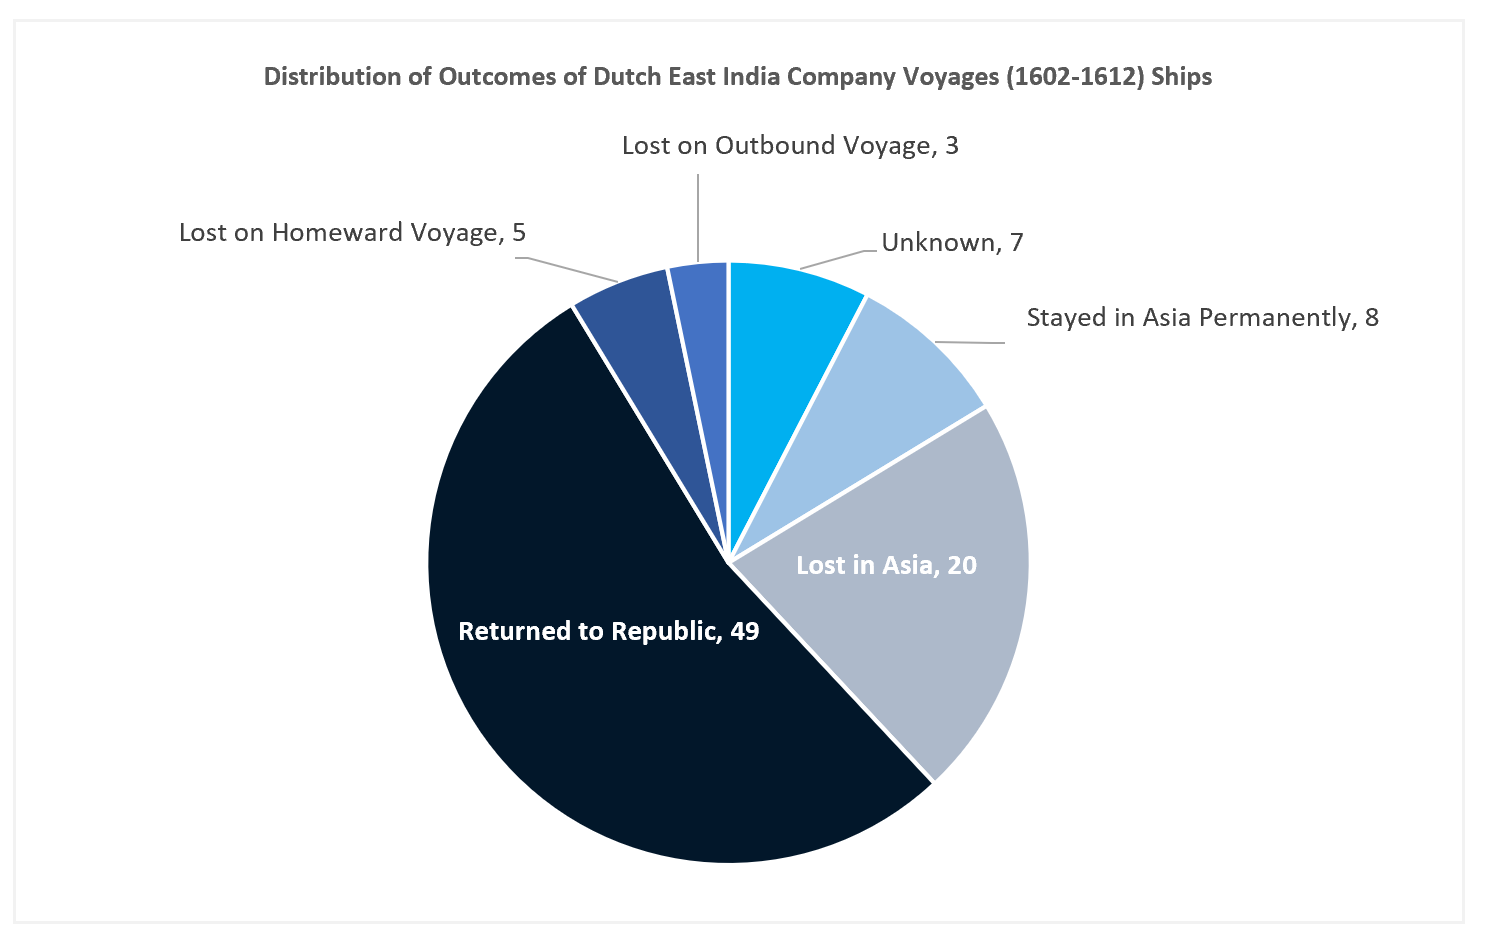
The solution to this problem was a new investment vehicle / corporate structure that facilitated better risk management capabilities: the joint-stock company. This innovation allowed merchants to form companies that could raise capital by selling shares to outside investors. By widening the investor base, the investment required from each individual was lowered. This reduced their risk and allowed merchants to diversify their remaining capital across multiple voyages.
“Distant voyages funded by multiple investors reduced this risk. Since each contributes a small portion, the risk borne to them is less than it would be if it were funded by one person.
The consolidation of assets in this manner makes each contributing member an owner, or shareholder, of a joint stock venture. The emergence of joint stock trading companies was created out of the need for increased funding requirements.”2
The joint-stock company example demonstrates how investment vehicles can provide the structure for unlocking new risk management capabilities.
The Great Unbundling: Investment Vehicle Innovations Today
Today there is no shortage of options for diversified market exposure (ETFs, mutual funds, etc). Investors now face a different problem, which is ironically linked to the innovations offering this diversified market exposure: lack of customization and control.
Commingled funds are great because their “one-size fits all” structure allows them to offer one diversified strategy for thousands of investors at a low cost. However, these commingled funds are restrictive because their “one-size fits all” structure allows them to offer one diversified strategy for thousands of investors.
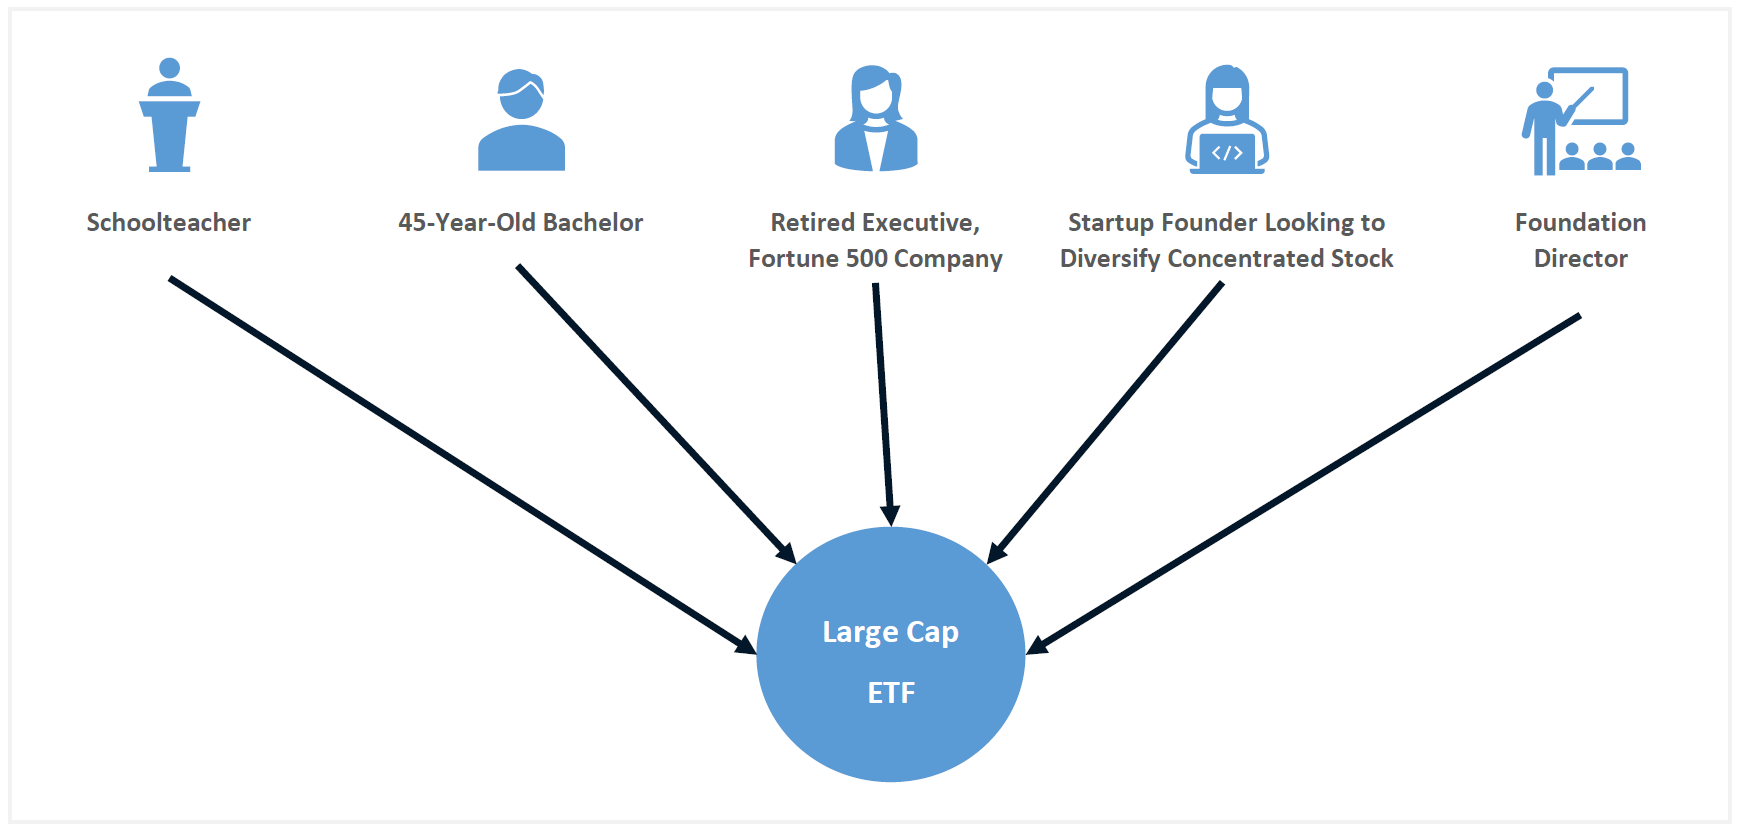
ETFs facilitate risk management through diversification but cannot be customized to better address an individual’s unique circumstances. This problem is illustrated below, where five investors with distinct risk profiles, incomes, and time horizons are grouped into one fund that treats every investor the same.
Like in the 17th century, it is an investment vehicle providing the underlying structure for a new innovation to build upon: Separately Managed Accounts (SMA). These vehicles are unique because investors directly own the underlying securities, instead of indirectly through shares of a pre-packaged mutual fund / ETF.
The SMA vehicle, paired with recent innovations in portfolio management technology and zero-commission trading, have produced a new investment offering that customizes portfolios to each investor’s unique risks and circumstances. Investors can think of this process as “unbundling” an ETF or mutual fund’s holdings so that they can be customized to the individual: Custom Indexing.
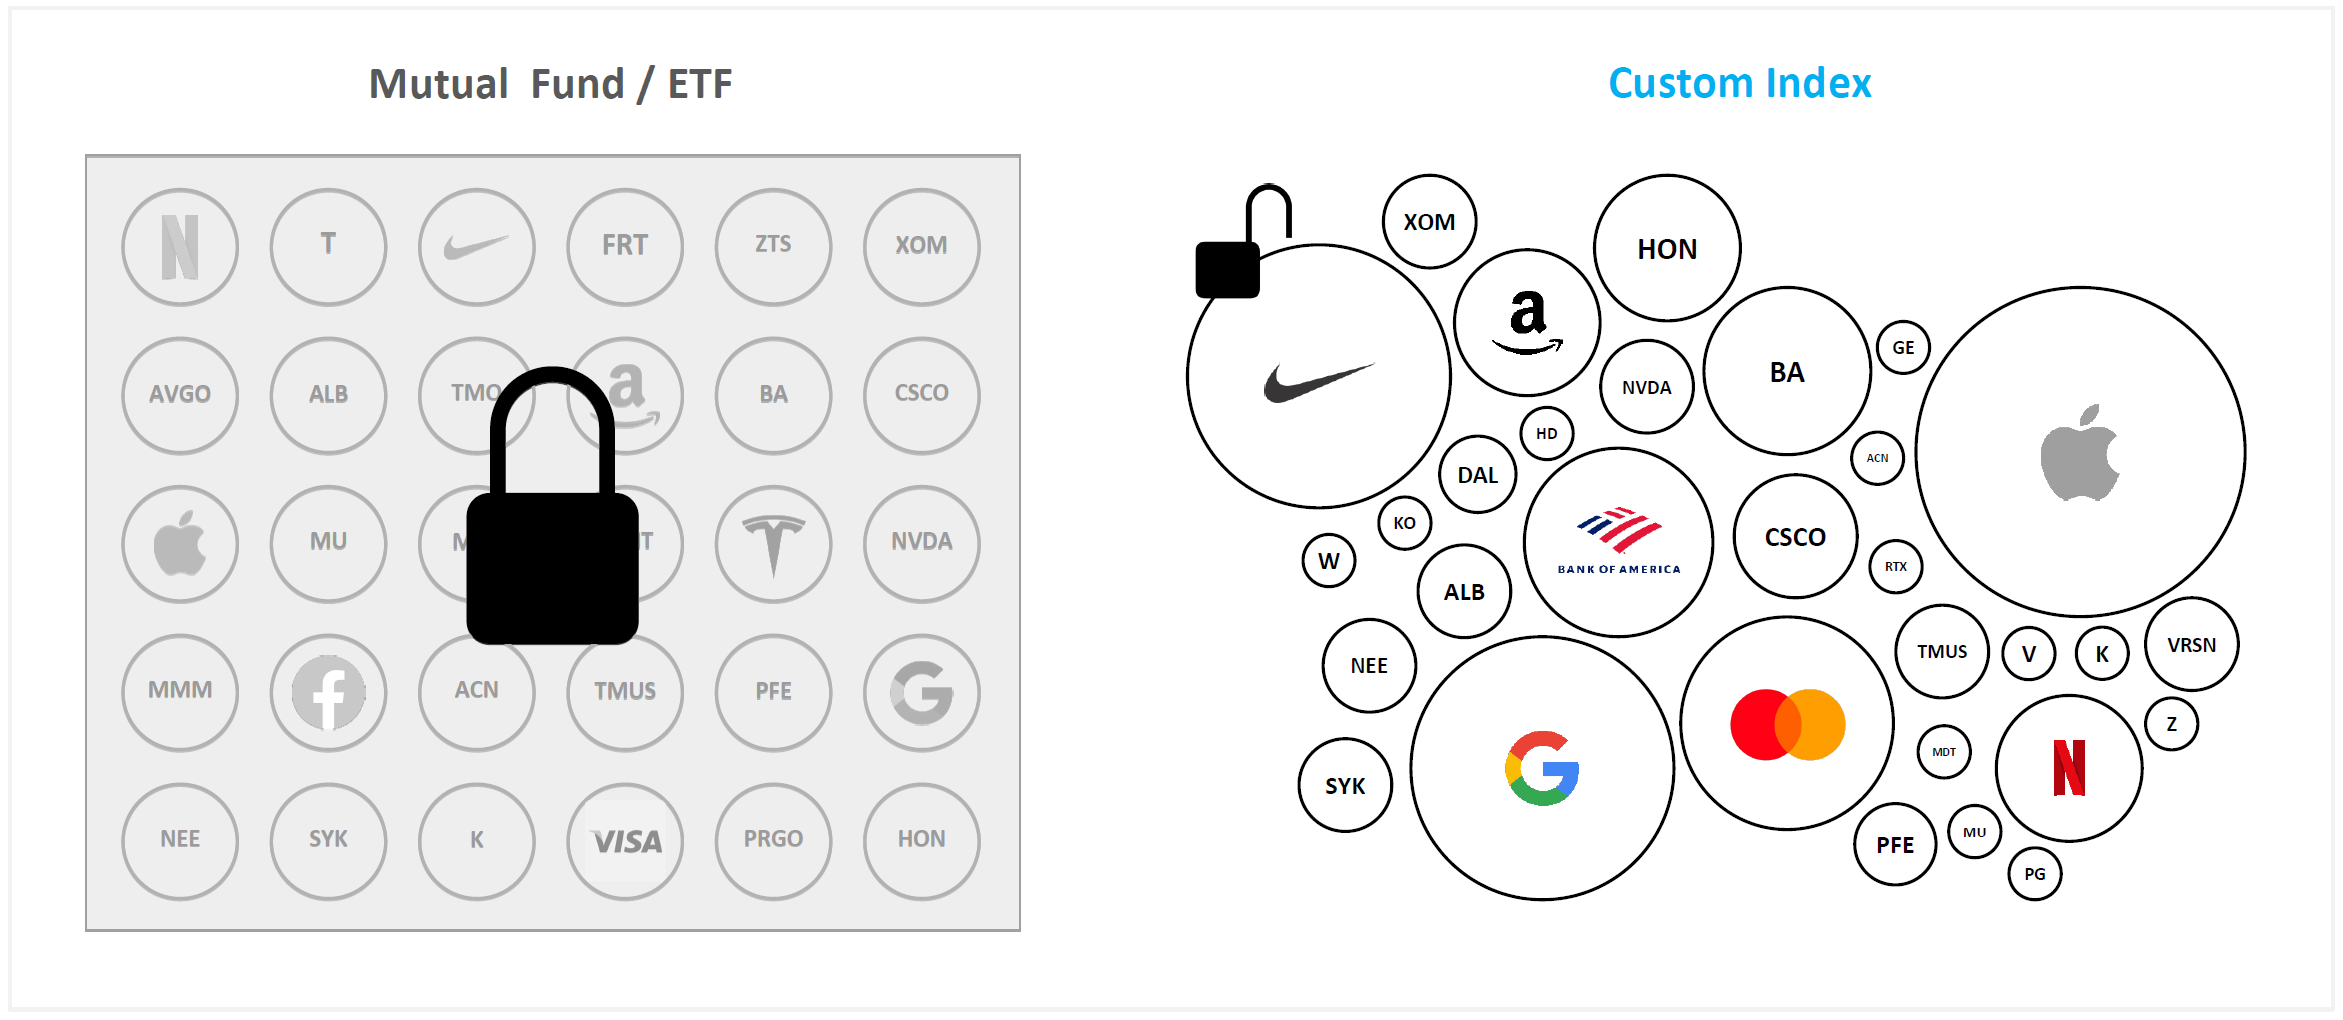
By directly owning individual securities, Custom Indexing allows individuals to better manage their risk. For example, if a Texas family’s wealth is directly tied to the Oil & Gas industry, they could manage that risk in a Custom Index by screening out all Energy stocks to avoid increasing their exposure further.
Implementing simple rules like underweighting / avoiding Energy stocks helps reduce the odds of meaningful losses by not increasing the weight of an already concentrated exposure in Energy. “Don’t play chess under chandeliers”.
Conclusion
Investment vehicles provide the structure for implementing rules and processes to “win” by “not losing”.
Commingled funds were revolutionary for providing access to diversified portfolios at a low cost. Due to advances in technology and investment vehicles, however, you don’t have to choose between cost, diversification, or customization. You can have it all for the same cost, with diversification that works for you, and customized to any objectives you have.
In the next installment of this three-part series we will cover how technological innovations and advances in data analytics leverage this unbundled structure to manage risk more effectively than ever.
Footnotes
1 Arthur Korteweg & Berk Sensoy, How Unique is VC’s American History? (June 2021)
2 Tu Kha Tran, Growth of Joint Stock Companies in The 17th Century" (2008)
GENERAL LEGAL DISCLOSURES & HYPOTHETICAL AND/OR BACKTESTED RESULTS DISCLAIMER
The material contained herein is intended as a general market commentary. Opinions expressed herein are solely those of O’Shaughnessy Asset Management, LLC and may differ from those of your broker or investment firm.
Please remember that past performance may not be indicative of future results. Different types of investments involve varying degrees of risk, and there can be no assurance that the future performance of any specific investment, investment strategy, or product (including the investments and/or investment strategies recommended or undertaken by O’Shaughnessy Asset Management, LLC), or any non-investment related content, made reference to directly or indirectly in this piece will be profitable, equal any corresponding indicated historical performance level(s), be suitable for your portfolio or individual situation, or prove successful. Due to various factors, including changing market conditions and/or applicable laws, the content may no longer be reflective of current opinions or positions. Moreover, you should not assume that any discussion or information contained in this piece serves as the receipt of, or as a substitute for, personalized investment advice from O’Shaughnessy Asset Management, LLC. Any individual account performance information reflects the reinvestment of dividends (to the extent applicable), and is net of applicable transaction fees, O’Shaughnessy Asset Management, LLC’s investment management fee (if debited directly from the account), and any other related account expenses. Account information has been compiled solely by O’Shaughnessy Asset Management, LLC, has not been independently verified, and does not reflect the impact of taxes on non-qualified accounts. In preparing this report, O’Shaughnessy Asset Management, LLC has relied upon information provided by the account custodian. Please defer to formal tax documents received from the account custodian for cost basis and tax reporting purposes. Please remember to contact O’Shaughnessy Asset Management, LLC, in writing, if there are any changes in your personal/financial situation or investment objectives for the purpose of reviewing/evaluating/revising our previous recommendations and/or services, or if you want to impose, add, or modify any reasonable restrictions to our investment advisory services. Please Note: Unless you advise, in writing, to the contrary, we will assume that there are no restrictions on our services, other than to manage the account in accordance with your designated investment objective. Please Also Note: Please compare this statement with account statements received from the account custodian. The account custodian does not verify the accuracy of the advisory fee calculation. Please advise us if you have not been receiving monthly statements from the account custodian. Historical performance results for investment indices and/or categories have been provided for general comparison purposes only, and generally do not reflect the deduction of transaction and/or custodial charges, the deduction of an investment management fee, nor the impact of taxes, the incurrence of which would have the effect of decreasing historical performance results. It should not be assumed that your account holdings correspond directly to any comparative indices. To the extent that a reader has any questions regarding the applicability of any specific issue discussed above to his/her individual situation, he/she is encouraged to consult with the professional advisor of his/her choosing. O’Shaughnessy Asset Management, LLC is neither a law firm nor a certified public accounting firm and no portion of the newsletter content should be construed as legal or accounting advice. A copy of the O’Shaughnessy Asset Management, LLC’s current written disclosure statement discussing our advisory services and fees is available upon request.
The risk-free rate used in the calculation of Sortino, Sharpe, and Treynor ratios is 5%, consistently applied across time.
The universe of All Stocks consists of all securities in the Chicago Research in Security Prices (CRSP) dataset or S&P Compustat Database (or other, as noted) with inflation-adjusted market capitalization greater than $200 million as of most recent year-end. The universe of Large Stocks consists of all securities in the Chicago Research in Security Prices (CRSP) dataset or S&P Compustat Database (or other, as noted) with inflation-adjusted market capitalization greater than the universe average as of most recent year-end. The stocks are equally weighted and generally rebalanced annually.
Hypothetical performance results shown on the preceding pages are backtested and do not represent the performance of any account managed by OSAM, but were achieved by means of the retroactive application of each of the previously referenced models, certain aspects of which may have been designed with the benefit of hindsight.
The hypothetical backtested performance does not represent the results of actual trading using client assets nor decision-making during the period and does not and is not intended to indicate the past performance or future performance of any account or investment strategy managed by OSAM. If actual accounts had been managed throughout the period, ongoing research might have resulted in changes to the strategy which might have altered returns. The performance of any account or investment strategy managed by OSAM will differ from the hypothetical backtested performance results for each factor shown herein for a number of reasons, including without limitation the following:
- Although OSAM may consider from time to time one or more of the factors noted herein in managing any account, it may not consider all or any of such factors. OSAM may (and will) from time to time consider factors in addition to those noted herein in managing any account.
- OSAM may rebalance an account more frequently or less frequently than annually and at times other than presented herein.
- OSAM may from time to time manage an account by using non-quantitative, subjective investment management methodologies in conjunction with the application of factors.
- The hypothetical backtested performance results assume full investment, whereas an account managed by OSAM may have a positive cash position upon rebalance. Had the hypothetical backtested performance results included a positive cash position, the results would have been different and generally would have been lower.
- The hypothetical backtested performance results for each factor do not reflect any transaction costs of buying and selling securities, investment management fees (including without limitation management fees and performance fees), custody and other costs, or taxes – all of which would be incurred by an investor in any account managed by OSAM. If such costs and fees were reflected, the hypothetical backtested performance results would be lower.
- The hypothetical performance does not reflect the reinvestment of dividends and distributions therefrom, interest, capital gains and withholding taxes.
- Accounts managed by OSAM are subject to additions and redemptions of assets under management, which may positively or negatively affect performance depending generally upon the timing of such events in relation to the market’s direction.
- Simulated returns may be dependent on the market and economic conditions that existed during the period. Future market or economic conditions can adversely affect the returns.
Please Note: Socially Responsible Investing Limitations. Socially Responsible Investing involves the incorporation of Environmental, Social and Governance considerations into the investment due diligence process (“ESG). There are potential limitations associated with allocating a portion of an investment portfolio in ESG securities (i.e., securities that have a mandate to avoid, when possible, investments in such products as alcohol, tobacco, firearms, oil drilling, gambling, etc.). The number of these securities may be limited when compared to those that do not maintain such a mandate. ESG securities could underperform broad market indices. Investors must accept these limitations, including potential for underperformance. Correspondingly, the number of ESG mutual funds and exchange traded funds are few when compared to those that do not maintain such a mandate. As with any type of investment (including any investment and/or investment strategies recommended and/or undertaken by OSAM), there can be no assurance that investment in ESG securities or funds will be profitable, or prove successful.


