Canvas Q2 Commentary
By OSAM Research TeamJuly 2021

Key Points:
• Equity markets put in a strong quarter—buoyed by optimism surrounding the ongoing pandemic recovery—which also built upon strong Q1 gains.
• Our key selection factors had mixed performance across universes for the quarter. Value underperformed in US Large and US Small-Mid, but slightly outperformed in International. Shareholder Yield underperformed in US Large but outperformed in International. Momentum underperformed in US Small-Mid but outperformed in US Large and International.
• Lower market cap stocks generally underperformed on the quarter across universes, which was a headwind for factor allocations relative to cap-weighted indexes.
• Poor quality stocks that rank low on our Earnings Quality, Earnings Growth, and Financial Strength generally outperformed on the quarter and year and detracted from returns.
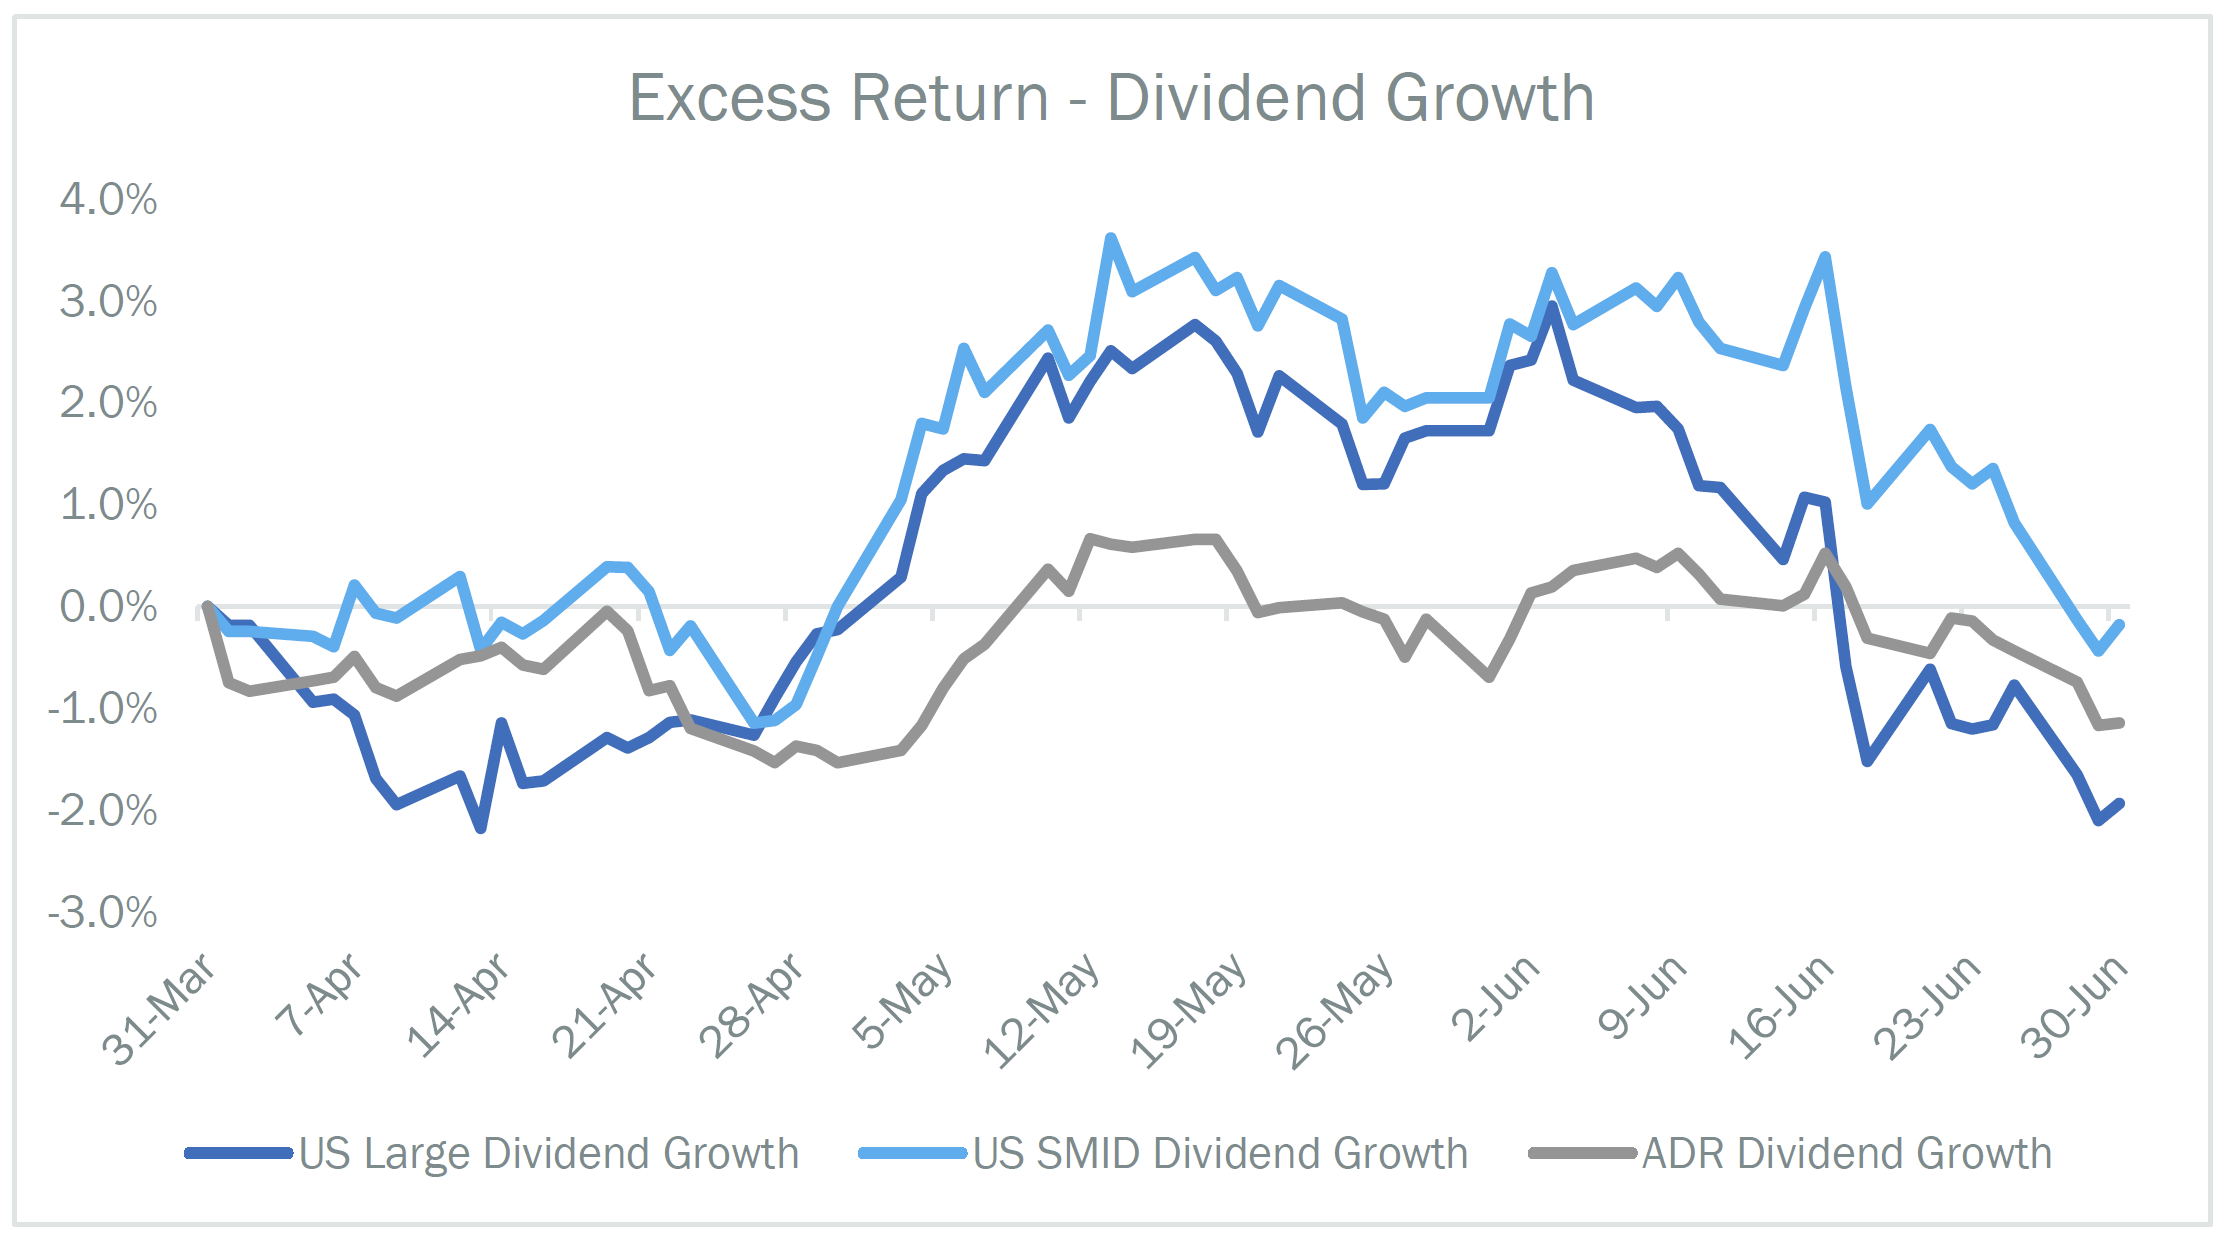
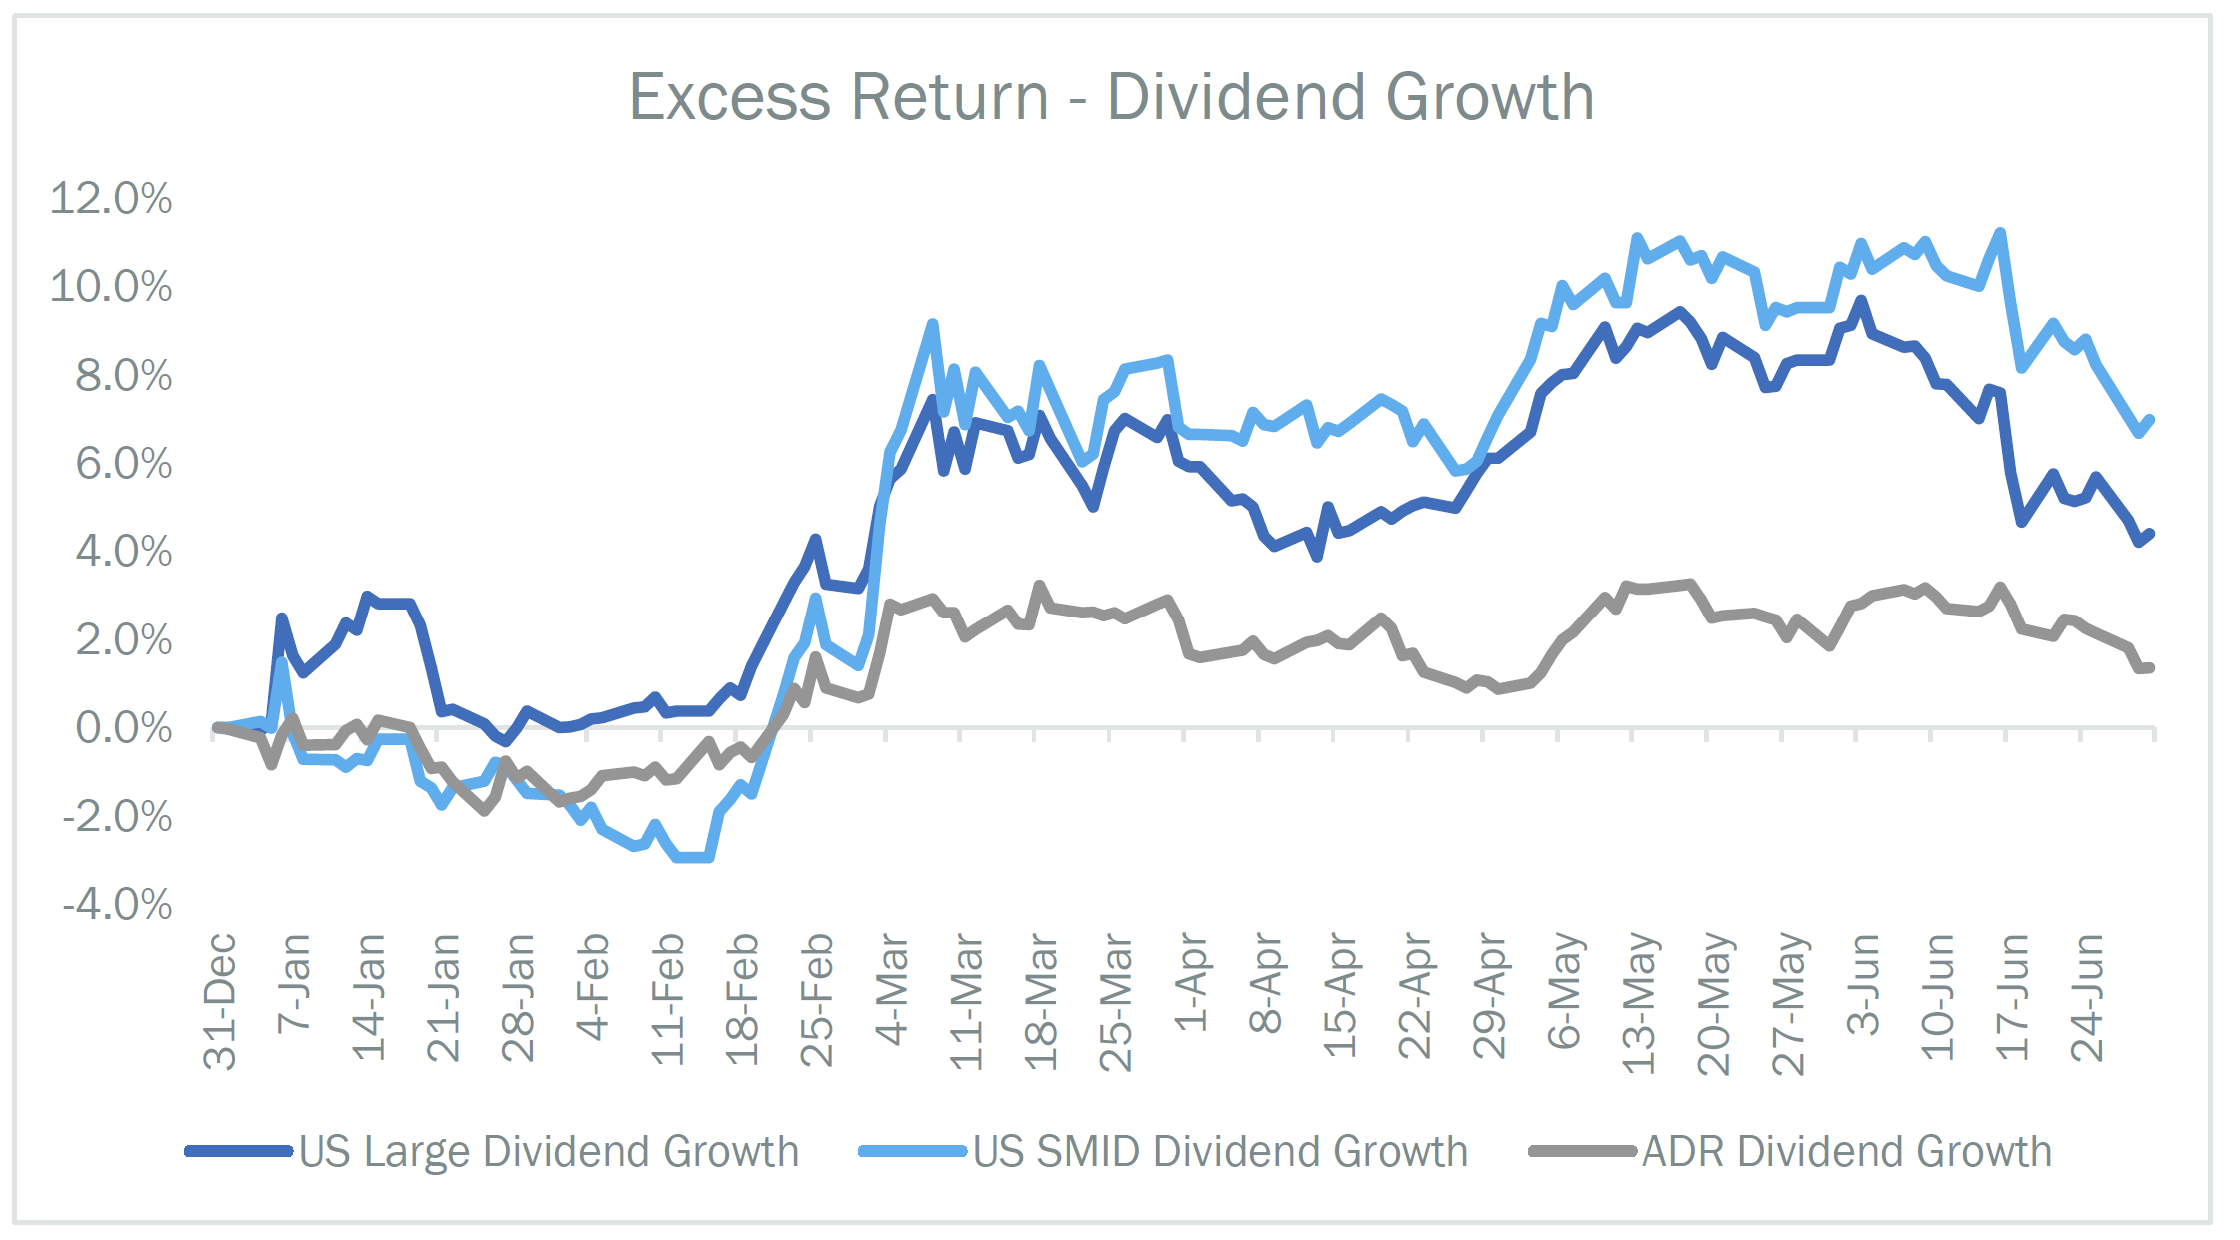
• Stocks ranking highly on our Stability theme—those with stability in sales, earnings, share issuance, and price volatility—and 5 year Dividend Growth generally outperformed early in the year and gave back some of their gains versus benchmarks in June.
With Q2 in the books, we are getting an increasingly clearer picture of what an economic recovery from a global pandemic looks like. Led by a continuation of the U.S vaccine rollout and easing of state regulations on masks and gatherings, there is at least some semblance of “normalcy”. The rate of individuals covered by vaccines rose from 23.1% on March 31st to 51.0% on June 30th. Over 330M vaccines have been administered in the United States alone. Mainland China’s total is above 1.3B, the EU at 384M, and India at 352M. Worldwide, 3.23B vaccines have been administered. This extraordinary effort, combined with historical fiscal stimulus, has shortened the recovery timeline. Yet, there continues to be work to be done with Japan lagging well behind the rest of the developed world.
The pace of new information and updates seem to only increase in velocity. Weekly Initial Jobless claims broke below 400k for the first time during the pandemic. The ADP private payrolls and the Bureau of Labor private non-farm payrolls (NFP) reports have continued to show unemployment decreasing as Covid lockdowns subside and restrictions on large gatherings are eased or abandoned. While unemployment rates have dropped significantly from the April 2020 high of 14.8%, June’s 5.9% reading still sits higher than the 3.5% figure pre-COVID-19. Returning to the historically low levels of unemployment seen in 2019 and early 2020 will require a great deal of work. For context, the last time unemployment was below 3.7% was in the late 1960s.
As the stock market continues hitting all-time highs and various assets experience parabolic rallies, inflation fears have grown. Lumber prices surged 6x from their April 2020 lows before then plummeting some 50% from their peak. Bitcoin and alternative cryptocurrencies hit a peak market cap of ~$2.5T but have since fallen to ~ $1.5T following a Chinese crackdown on non-sovereign digital currencies. Oil futures crossed $70 for the first time since 2018.
The CPI index rose 5.0% YoY ending May 2021, the largest increase since 5.4% in August 2008. Personal Consumption Expenditures, the Federal Open Market Committee’s (FOMC) preferred gauge of inflation, rose 3.9% YoY ending May 2021. Low mortgage rates and demand for property in suburban markets have produced a boom in housing prices, while sales of previously owned homes fell for a fourth straight month in May. According to the S&P CoreLogic Case-Shiller index, property prices rose 14.6% YoY ending May 2021, the largest increase since 1988. The index witnessed 11 straight months of price acceleration.
While members of the FOMC have acknowledged frothiness in certain assets, the broader narrative remains that “inflation is transitory”. This view is predicated on the belief that supply chain shortages and inflation gauges running above 2.0% are short-lived and will diminish moving forward. Interestingly, the FOMC recently signaled a seemingly hawkish departure from their stance on holding rates at zero, potentially addressing concerns that the economy will continue to run hot. The ECB and BOJ find themselves in quite a different position given the lack of inflation in their jurisdictions, despite massive stimulus.
For the first time since their emergency March 2020 meeting, the Fed expressed expectations of two rate hikes by the end of 2023. Markets quickly digested that information but continued marching higher. Since this shift in the Fed’s expectations, Growth stocks have handily outperformed. Gold rose from ~$1680/oz at the end of March to a peak of ~$1900/oz at the start of June, but sold off harshly on the news, closing below $1800/oz. Another consequence of the meeting was the FOMC raising the overnight reverse repo rate to 5bps. The demand for cash held at the Fed quickly rose and hit a record demand, peaking at $991.9B.
We also saw a drop and flattening of the U.S., German, and Japanese yield curve, which has tended to be correlated with Growth outperformance since the fall of 2020.1 This action seems to suggest that bond market participants believe the economy may not be ready for tighter monetary policy.
U.S. Large Stocks
Translating these moves to factor performance, Value has tended to be a proxy for the reflation trade. Though the move was underway since the poor April non-farm payrolls report was released on May 7th, the surprise hawkish shifting of dot plots and FOMC commentary at their June meeting drove a further re-pricing of the reflation trade and value underperformance.

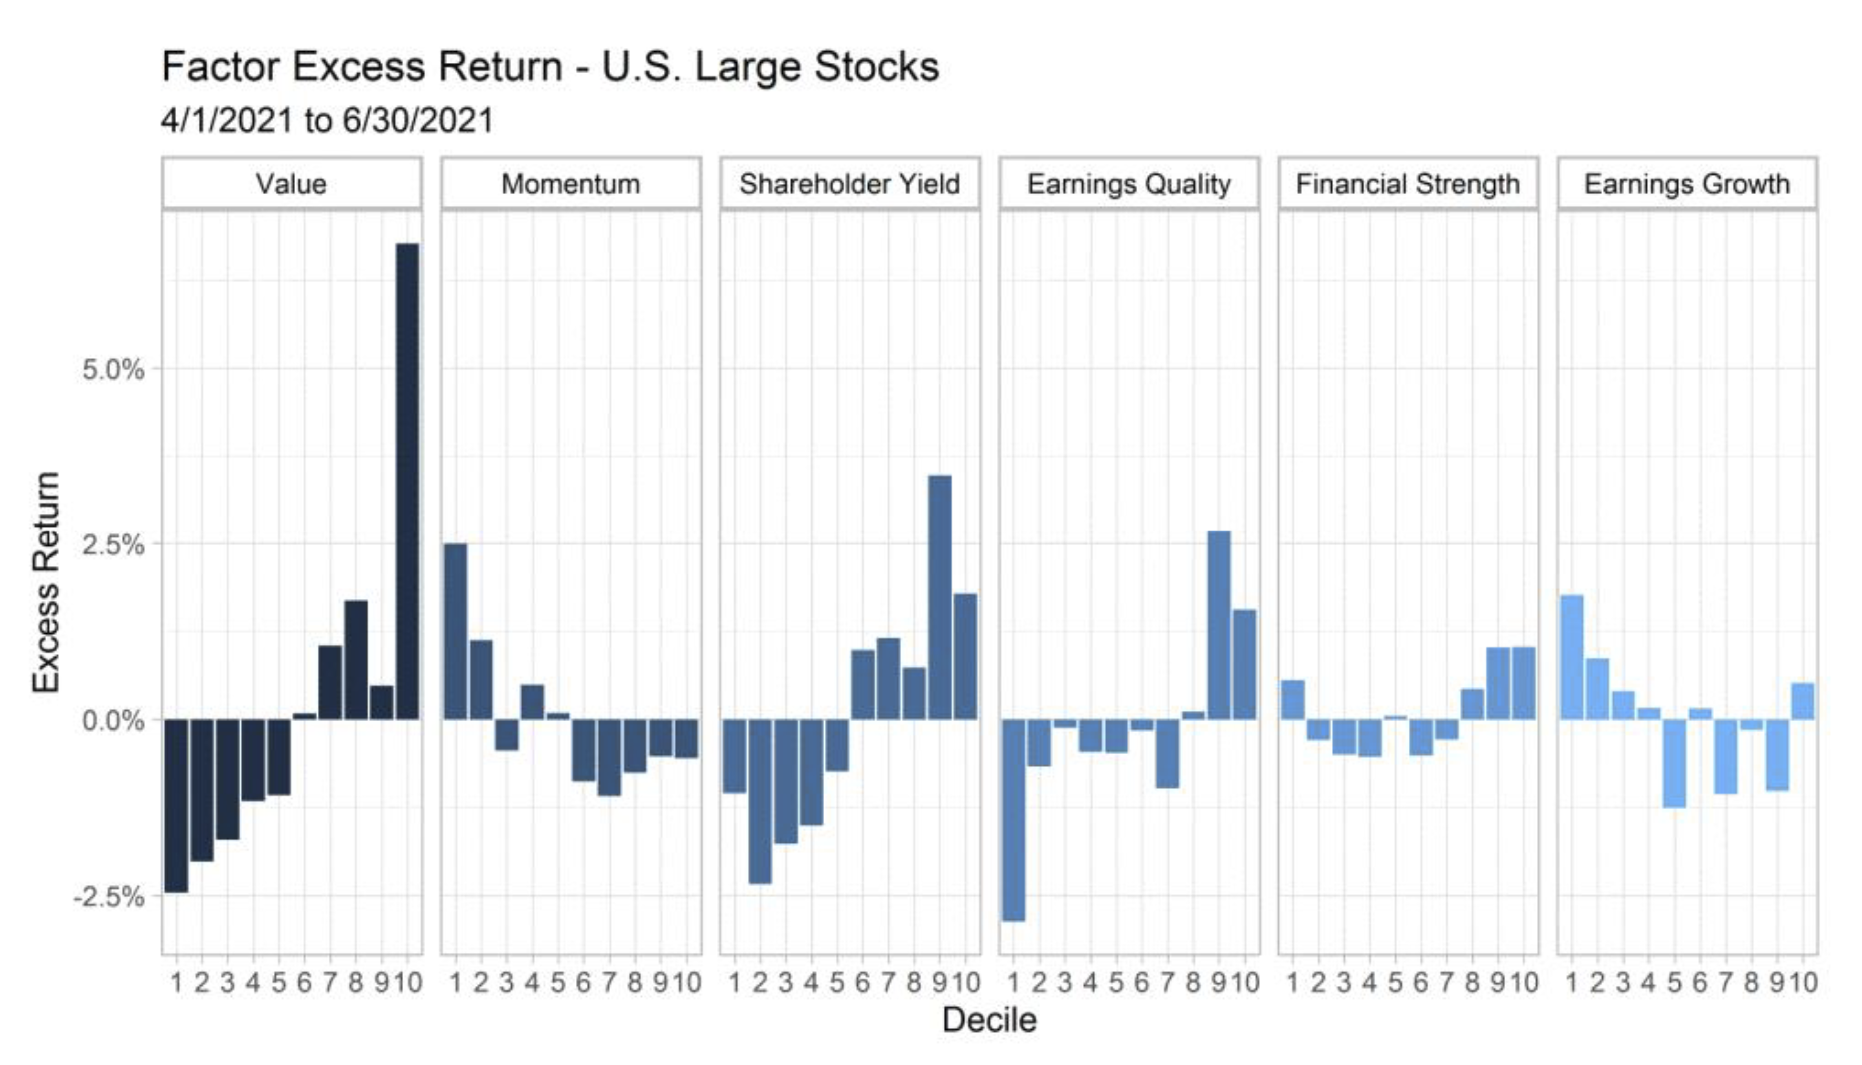
The panel below shows the excess performance of the six factor themes we monitor within U.S. large cap stocks. We think of Value, Momentum, and Shareholder Yield as selection factors—helping identify stocks we want to own and overweight. Earnings Quality, Financial Strength, and Earnings Growth are quality factors that allow us to avoid stocks with non-cash driven earnings, weak balance sheets, and questionable underlying businesses. Column 1 for each of the panels are the highest ranking on a factor while column 10 is the lowest ranking. Historically, owning the highest ranked and avoiding the lowest ranked has resulted in successful investment outcomes.
Thematically, Shareholder Yield performed in-line with Value though with a more compressed distribution (see panel below). More on this dynamic in the Outlook section. Momentum righted itself with the highest momentum decile outperforming the lowest. Quality themes (Earnings Quality, Financial Strength, and Earnings Growth) had mixed performance with the lowest ranked deciles outperforming—a trend that has been fairly persistent since summer 2020.
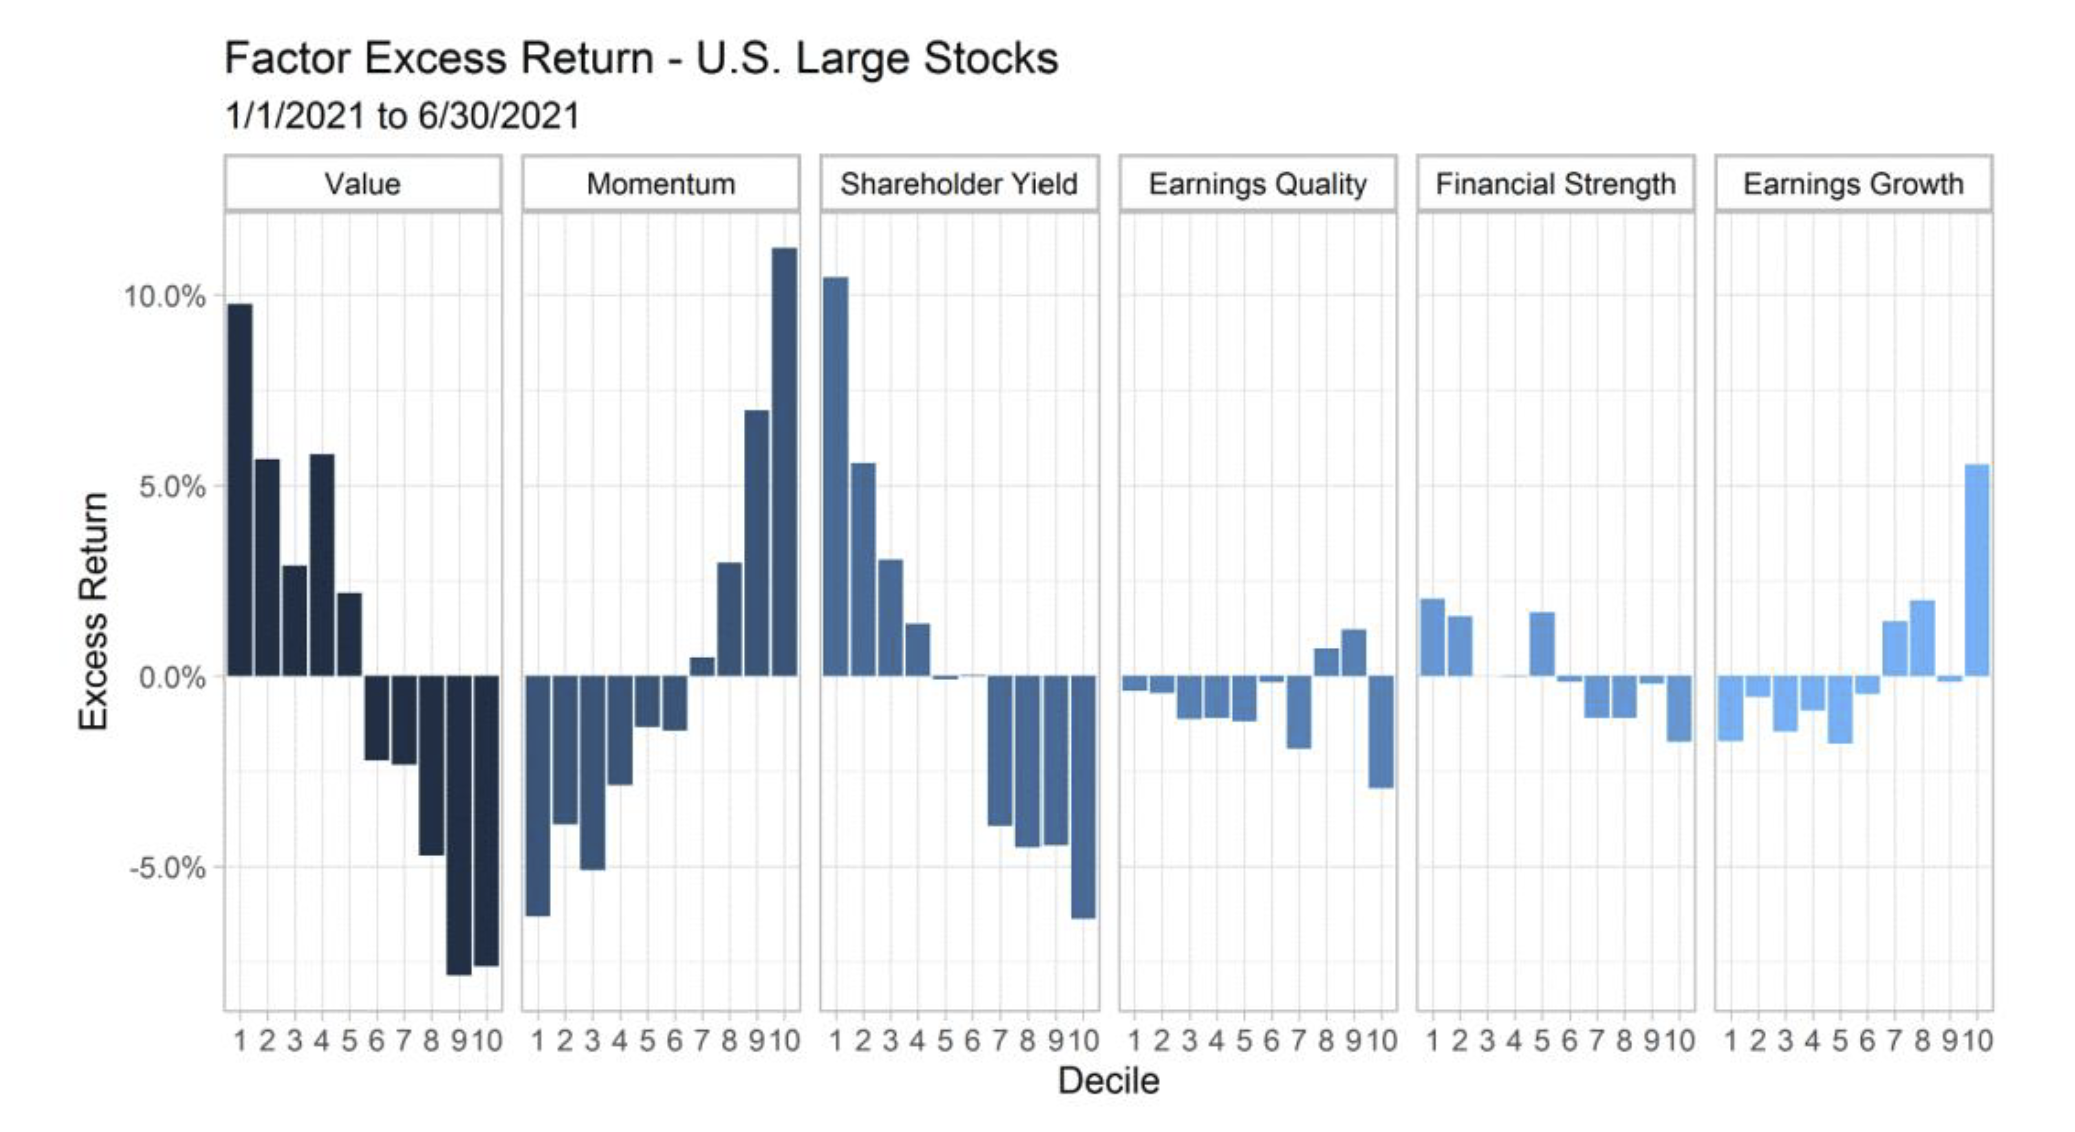
The chart below shows factor performance year to date. Value and Shareholder Yield have substantially outperformed on the full year, while Momentum has lagged. The quality themes had mixed performance, notably poor Earnings Growth companies—those with falling earnings and poor profitability—have been outperforming.
U.S. Small-Mid Stocks
The panel below shows the excess performance of the six factor themes we monitor within U.S. small-mid cap stocks. Column 1 for each of the panels are the highest ranking on a factor while column 10 is the lowest ranking. Historically, owning the highest ranked and avoiding the lowest ranked has resulted in successful investment outcomes.
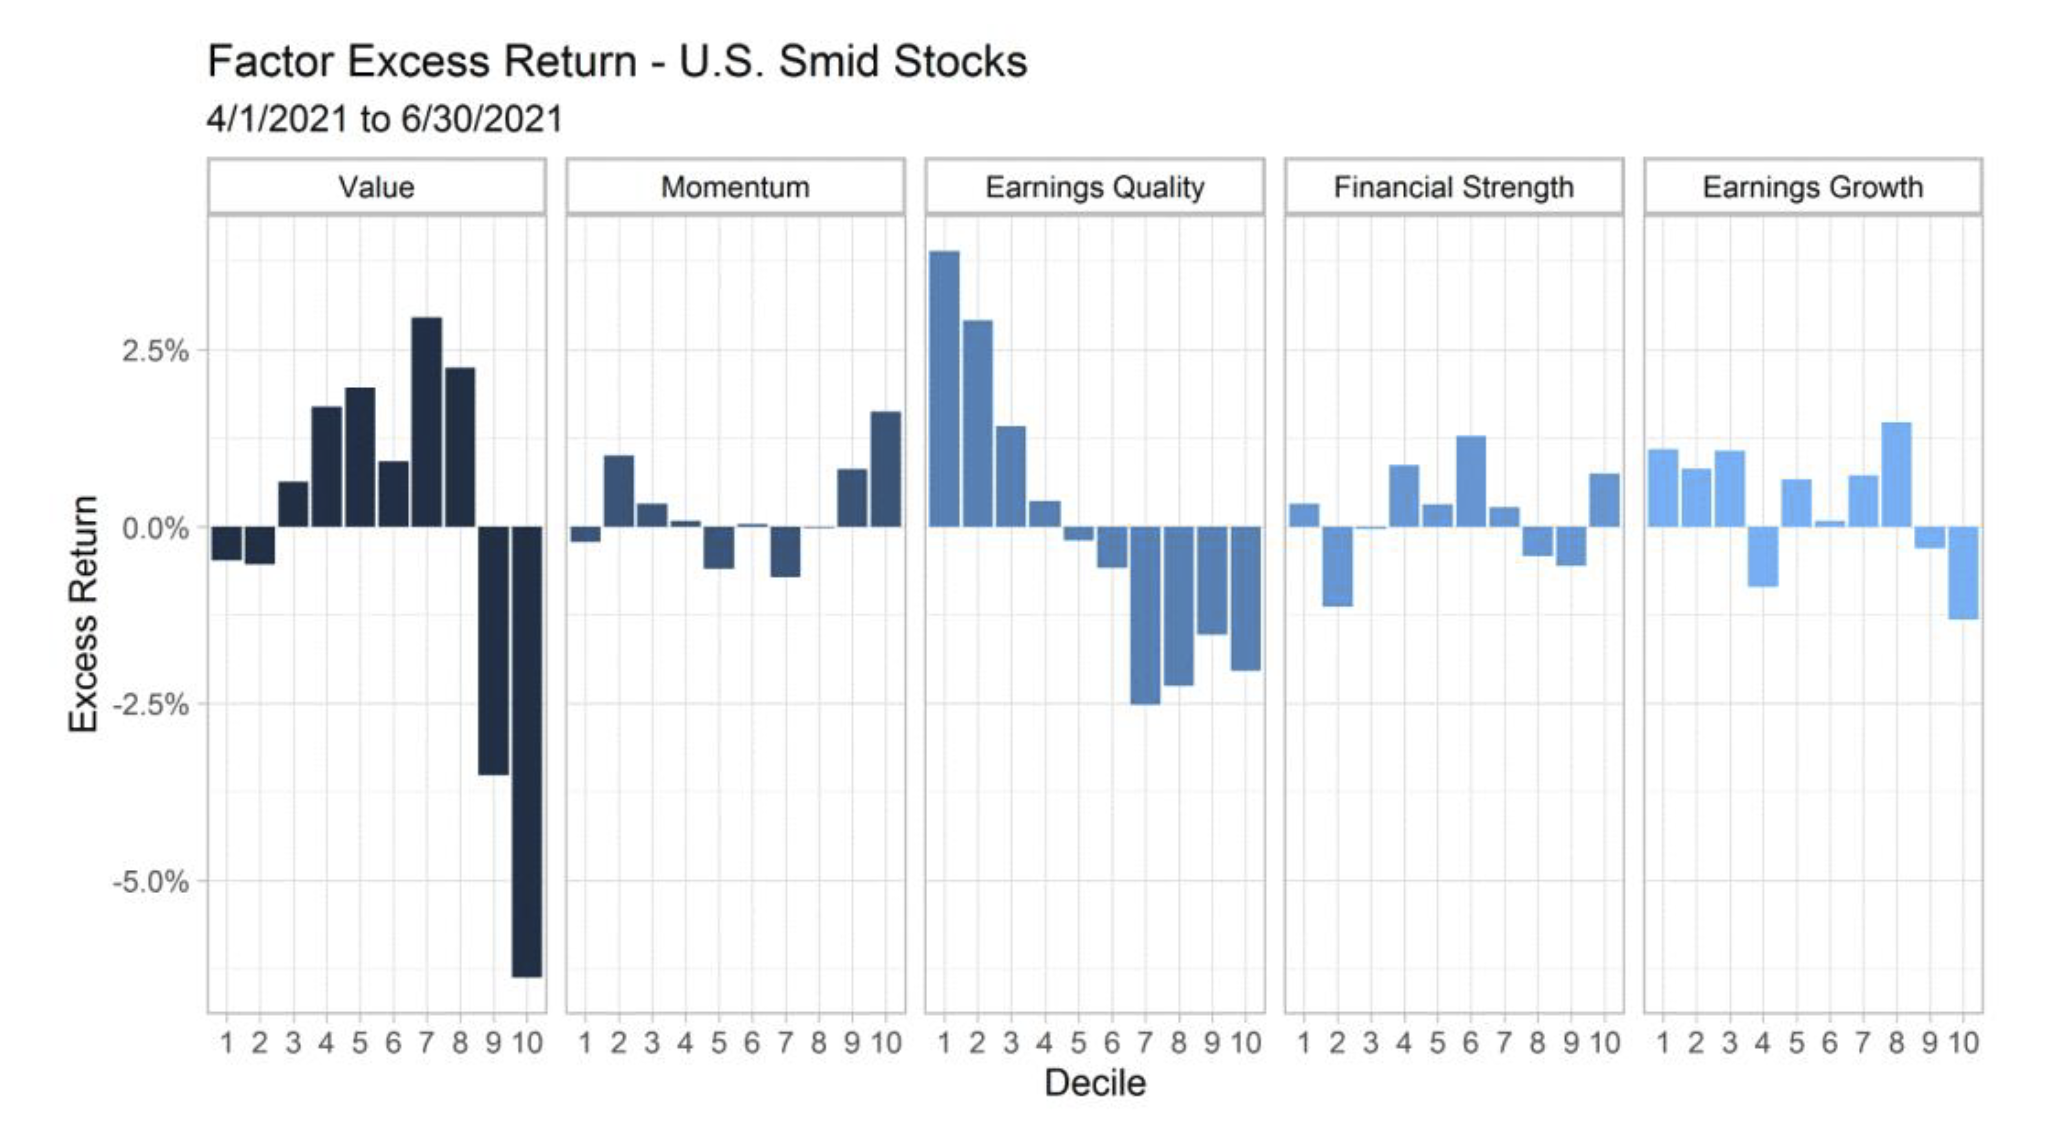
Value stocks (column 1) outperformed expensive growth stocks (column 10) by about 5%—further unwinding a decent chunk of growth’s outperformance from 2020. This runs contrary to the results in U.S. Large stocks where growth dramatically outperformed. Also contrary to the case in the large cap space, momentum inverted versus long-term historical norms. Again, it is not surprising that momentum is struggling in this environment as past losers (value) are gaining favor—most notably Energy and Financials.
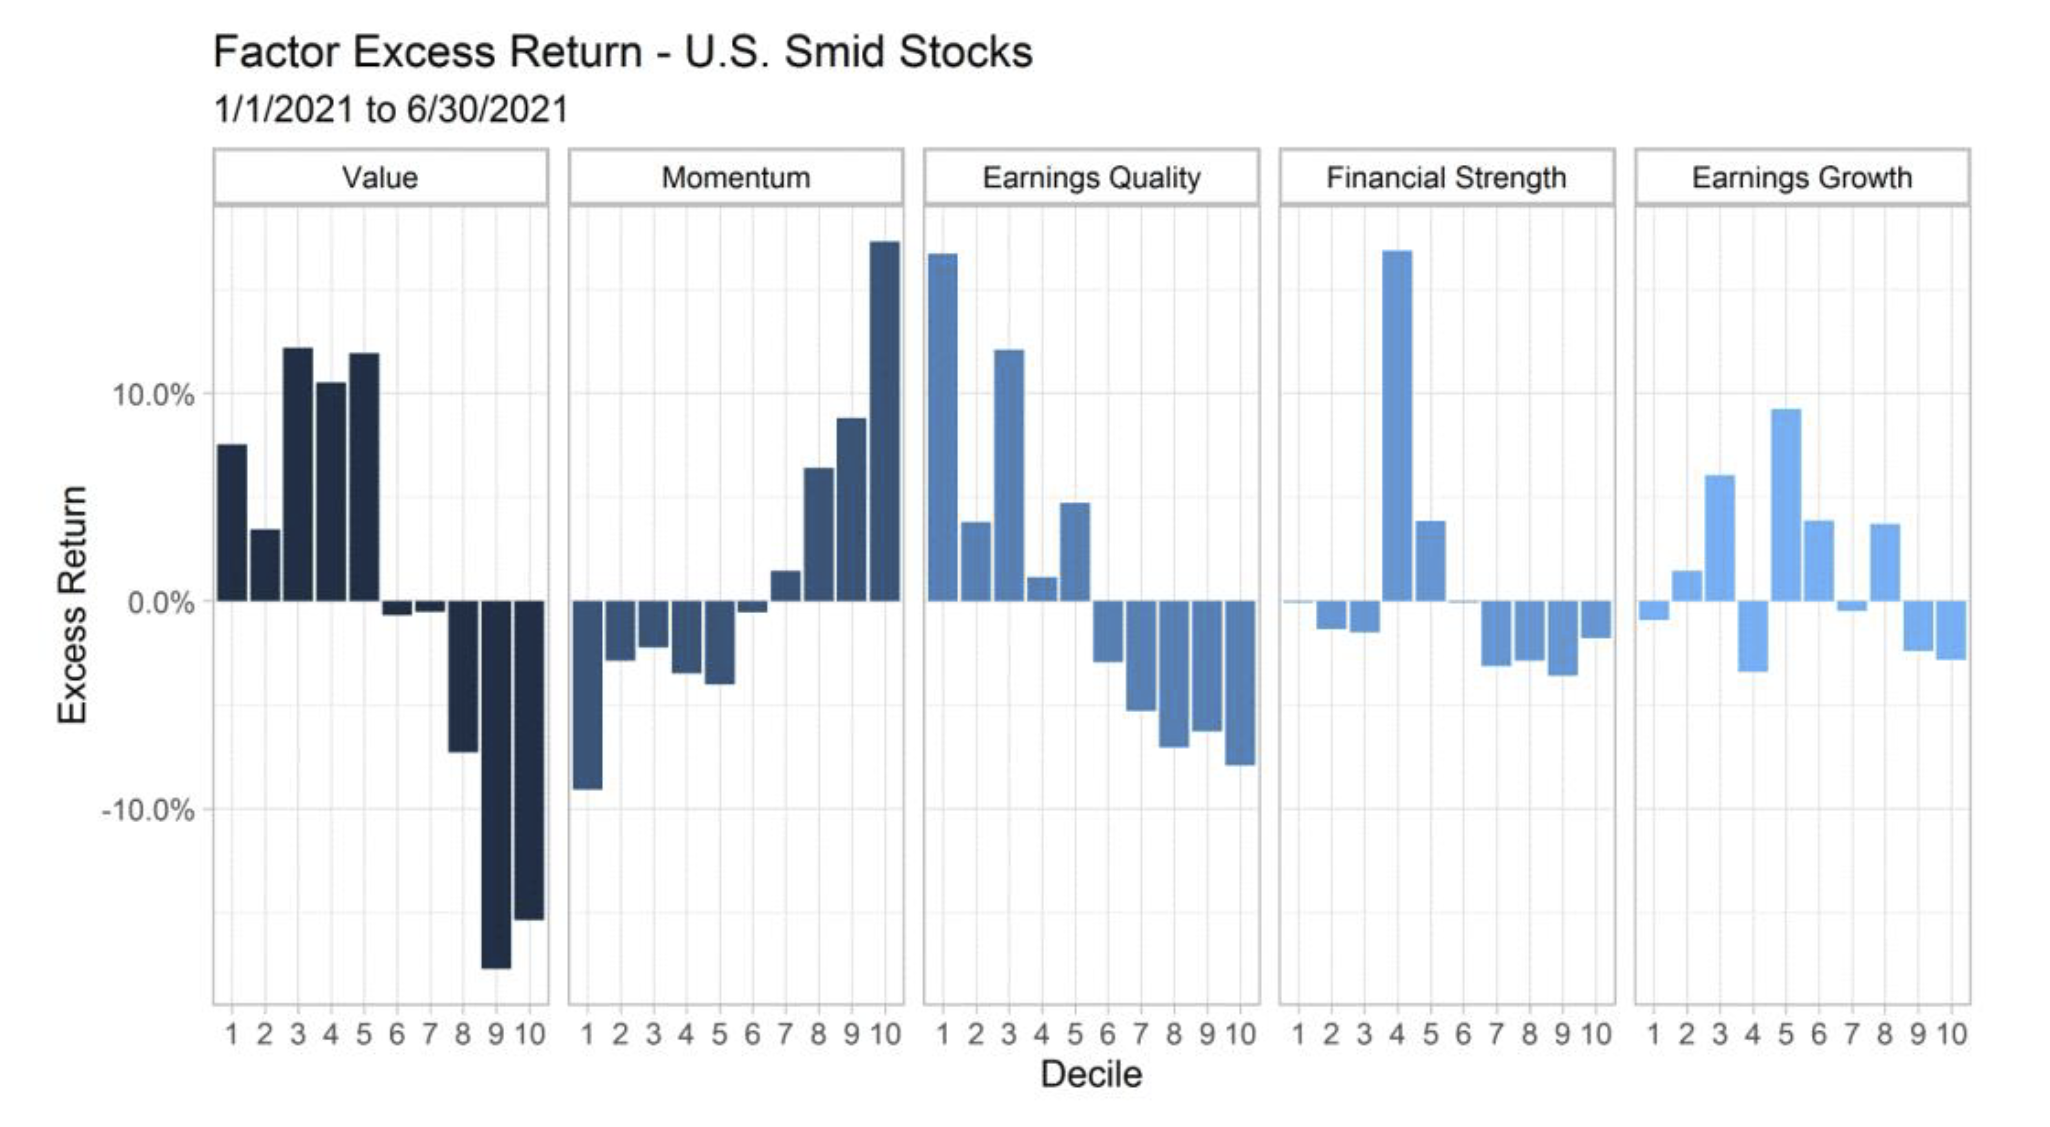
Year to date, the return profile for Value and Momentum is very similar to what we saw in U.S. Large Stocks—cheap value outperforming and strong momentum underperforming. The quality picture is mixed but had a greater influence on returns among small-mid cap stocks than among large stocks.
International ADR Stocks
The panel below shows the excess performance of the six factor themes we monitor within ADR All Stocks. The universe includes developed and emerging markets. In coming quarters, we will be breaking these out separately as we have added capability to Canvas to allocate to developed and emerging via individual strategies.
Emerging markets peaked around mid-February, which roughly coincided with a low in the trade-weighted dollar. As USD strengthened about 4% from that point into the close of the quarter, it took the wind out of EM’s sails. On the chart below, column 1 for each of the panels are the highest ranking on a factor while column 10 is the lowest ranking. Historically, owning the highest ranked and avoiding the lowest ranked has resulted in successful investment outcomes.
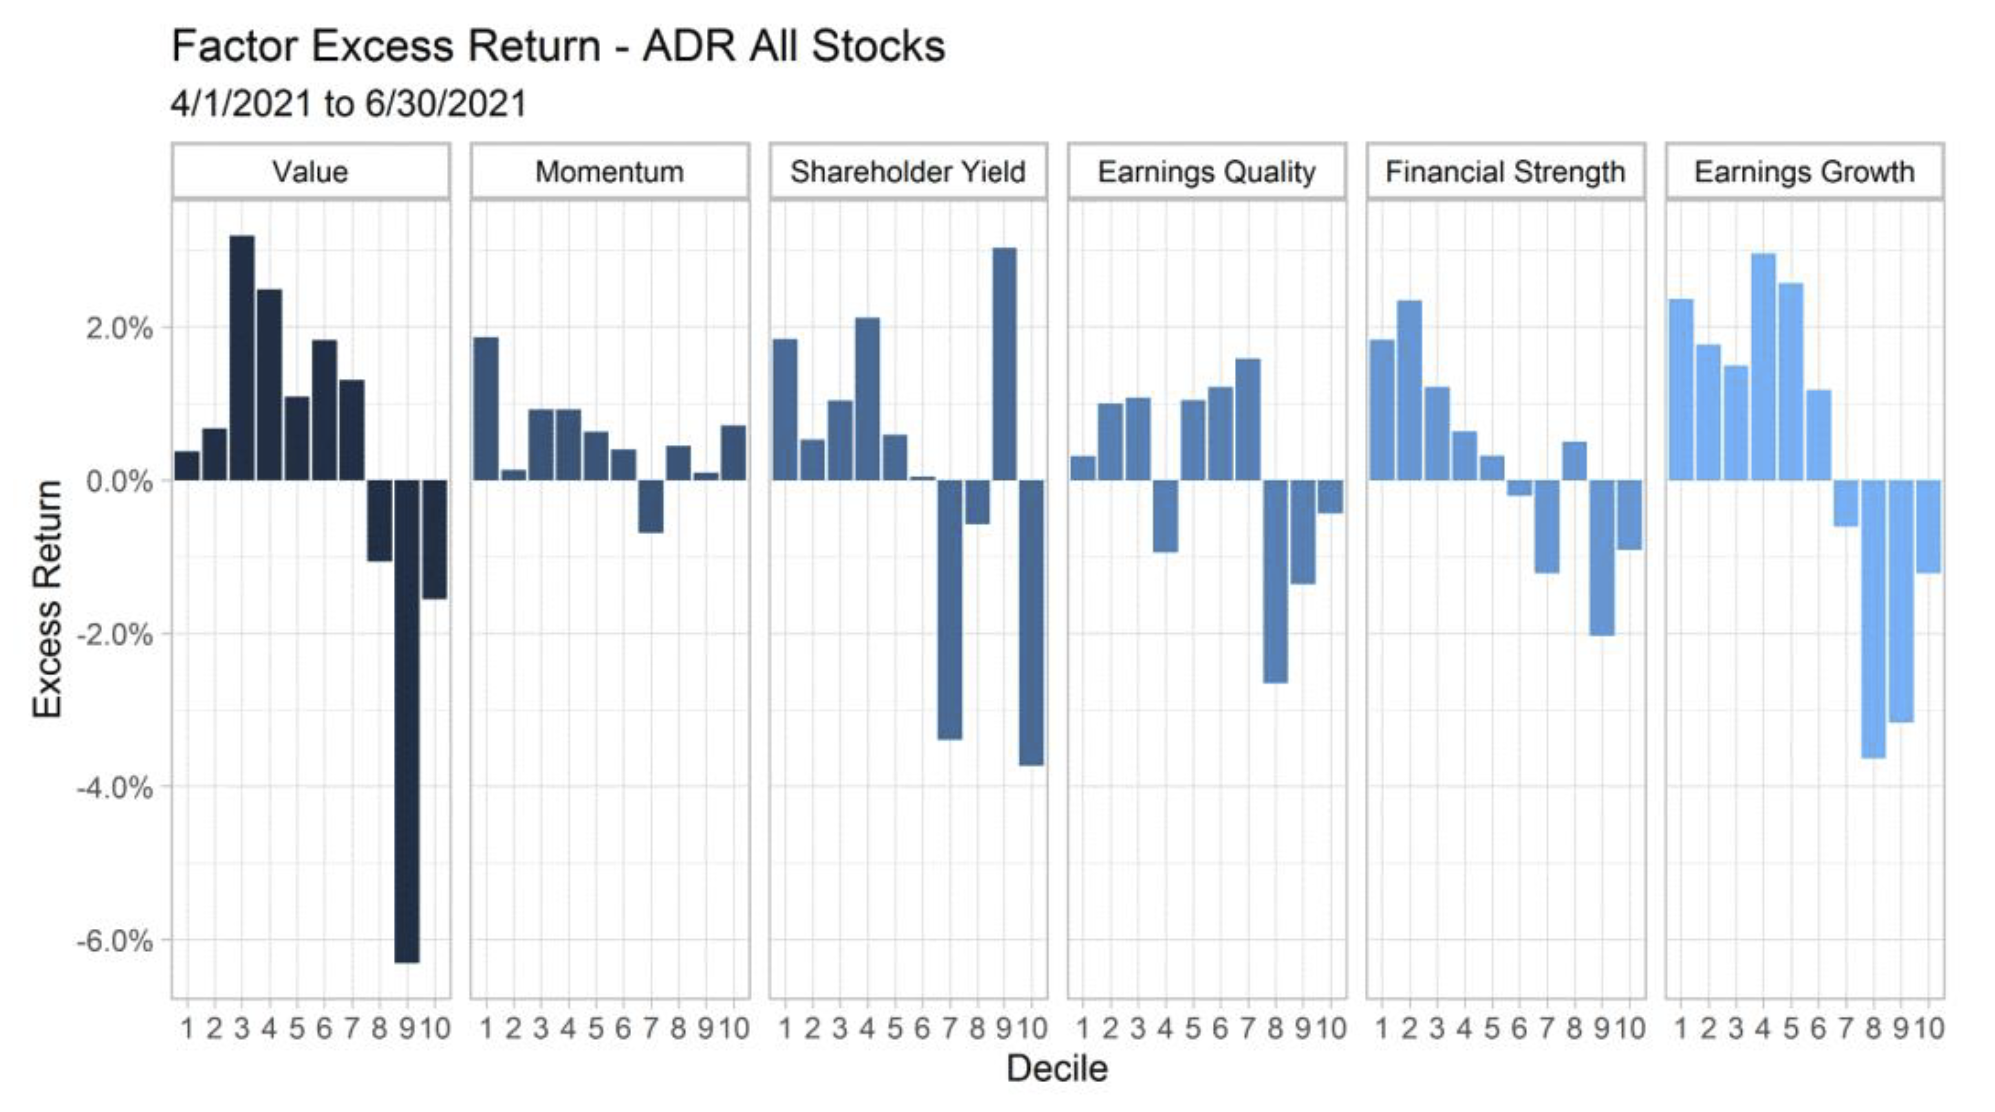
Value stocks (column 1) outperformed expensive growth stocks (column 10), contrary to what we saw in the U.S. This is similar to what was experienced in 2020—growth’s dominance is not as powerful in developed and emerging markets. Momentum performed in-line with long-term historical norms with the highest Momentum decile outperforming. Shareholder Yield tends to be aligned with value, and in fact, outperformed value on the quarter. Poor quality names generally underperformed on the quarter.
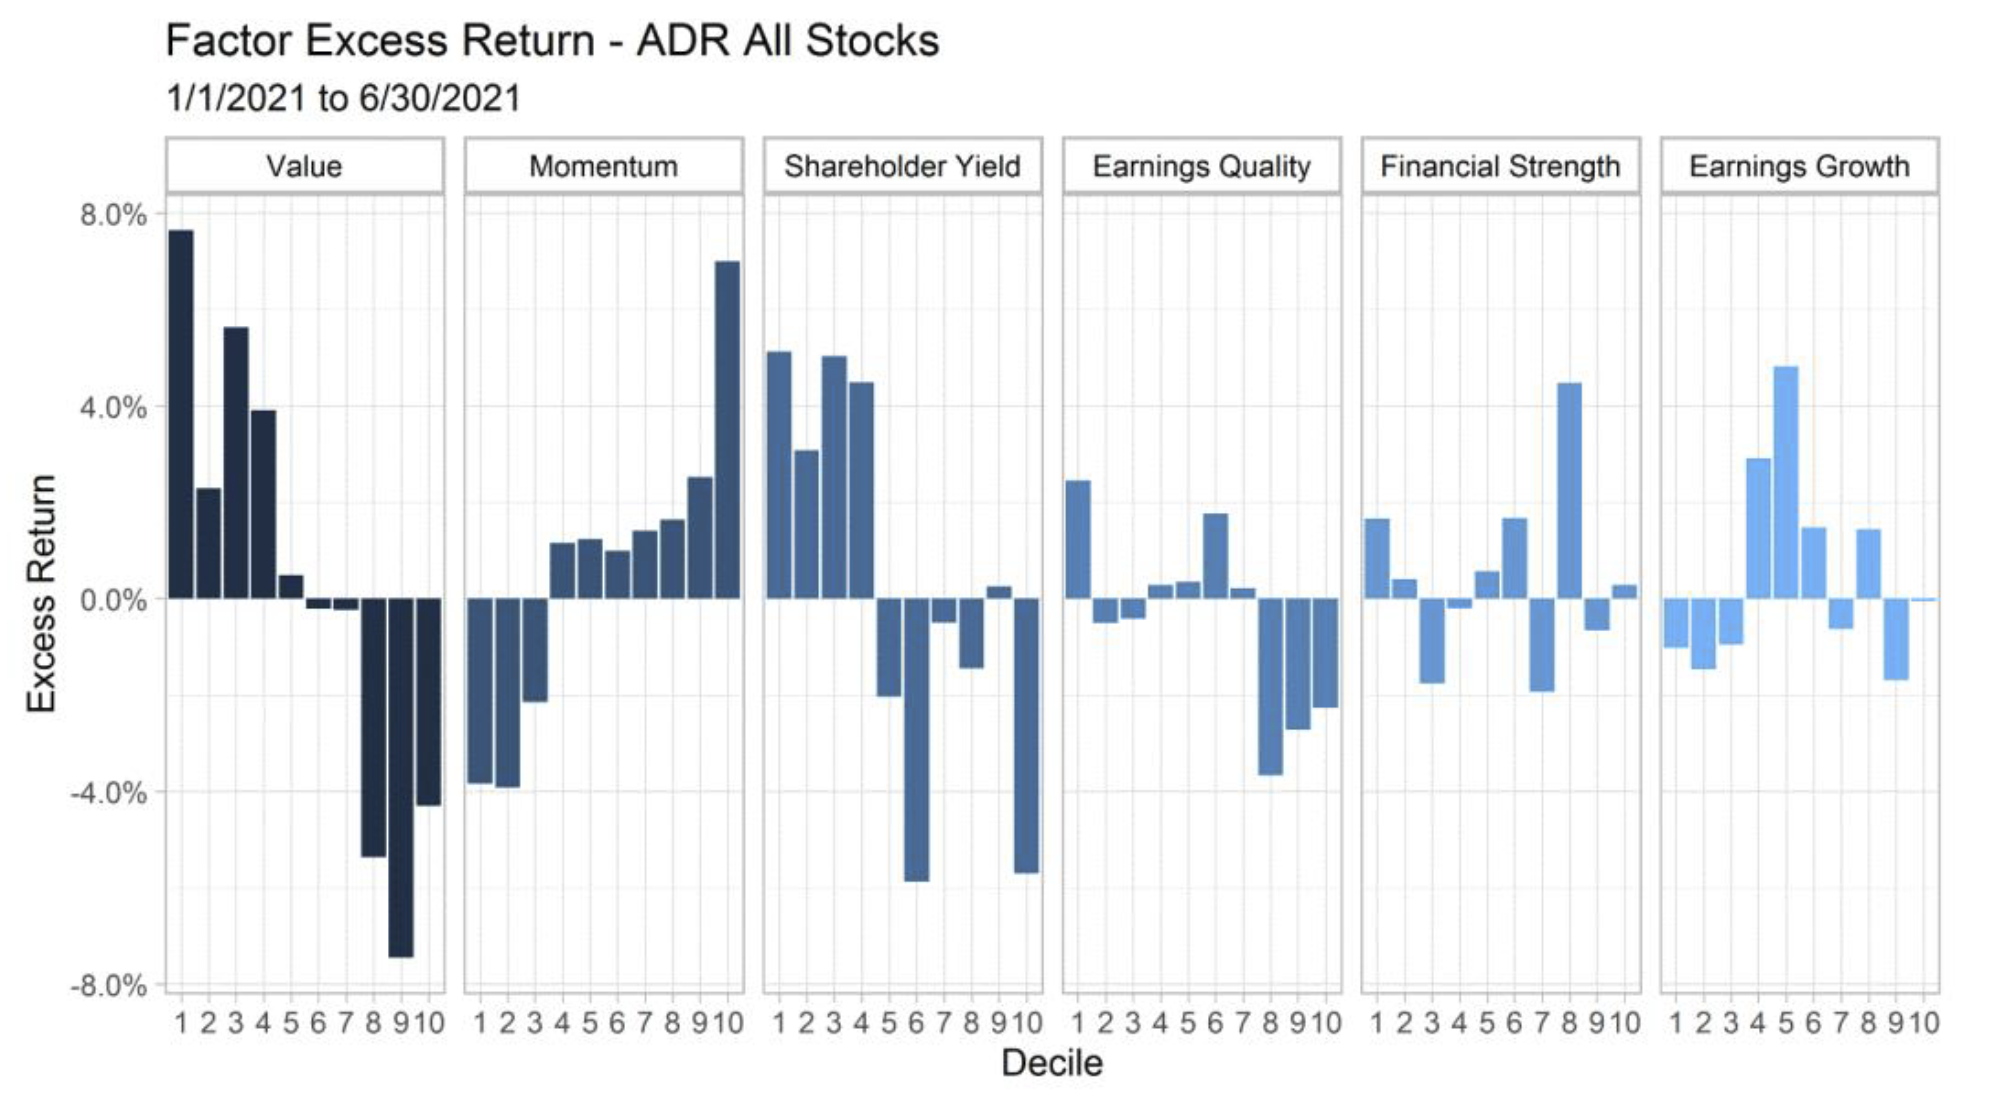
On the year, the return profile for Value and Momentum is very similar to what we saw in U.S. Large and Small-mid stocks—cheap value outperforming and strong momentum underperforming. The quality picture is mixed but had a greater influence on returns among international stocks than among U.S. Large stocks.
Defensive Stability and Dividend Growth
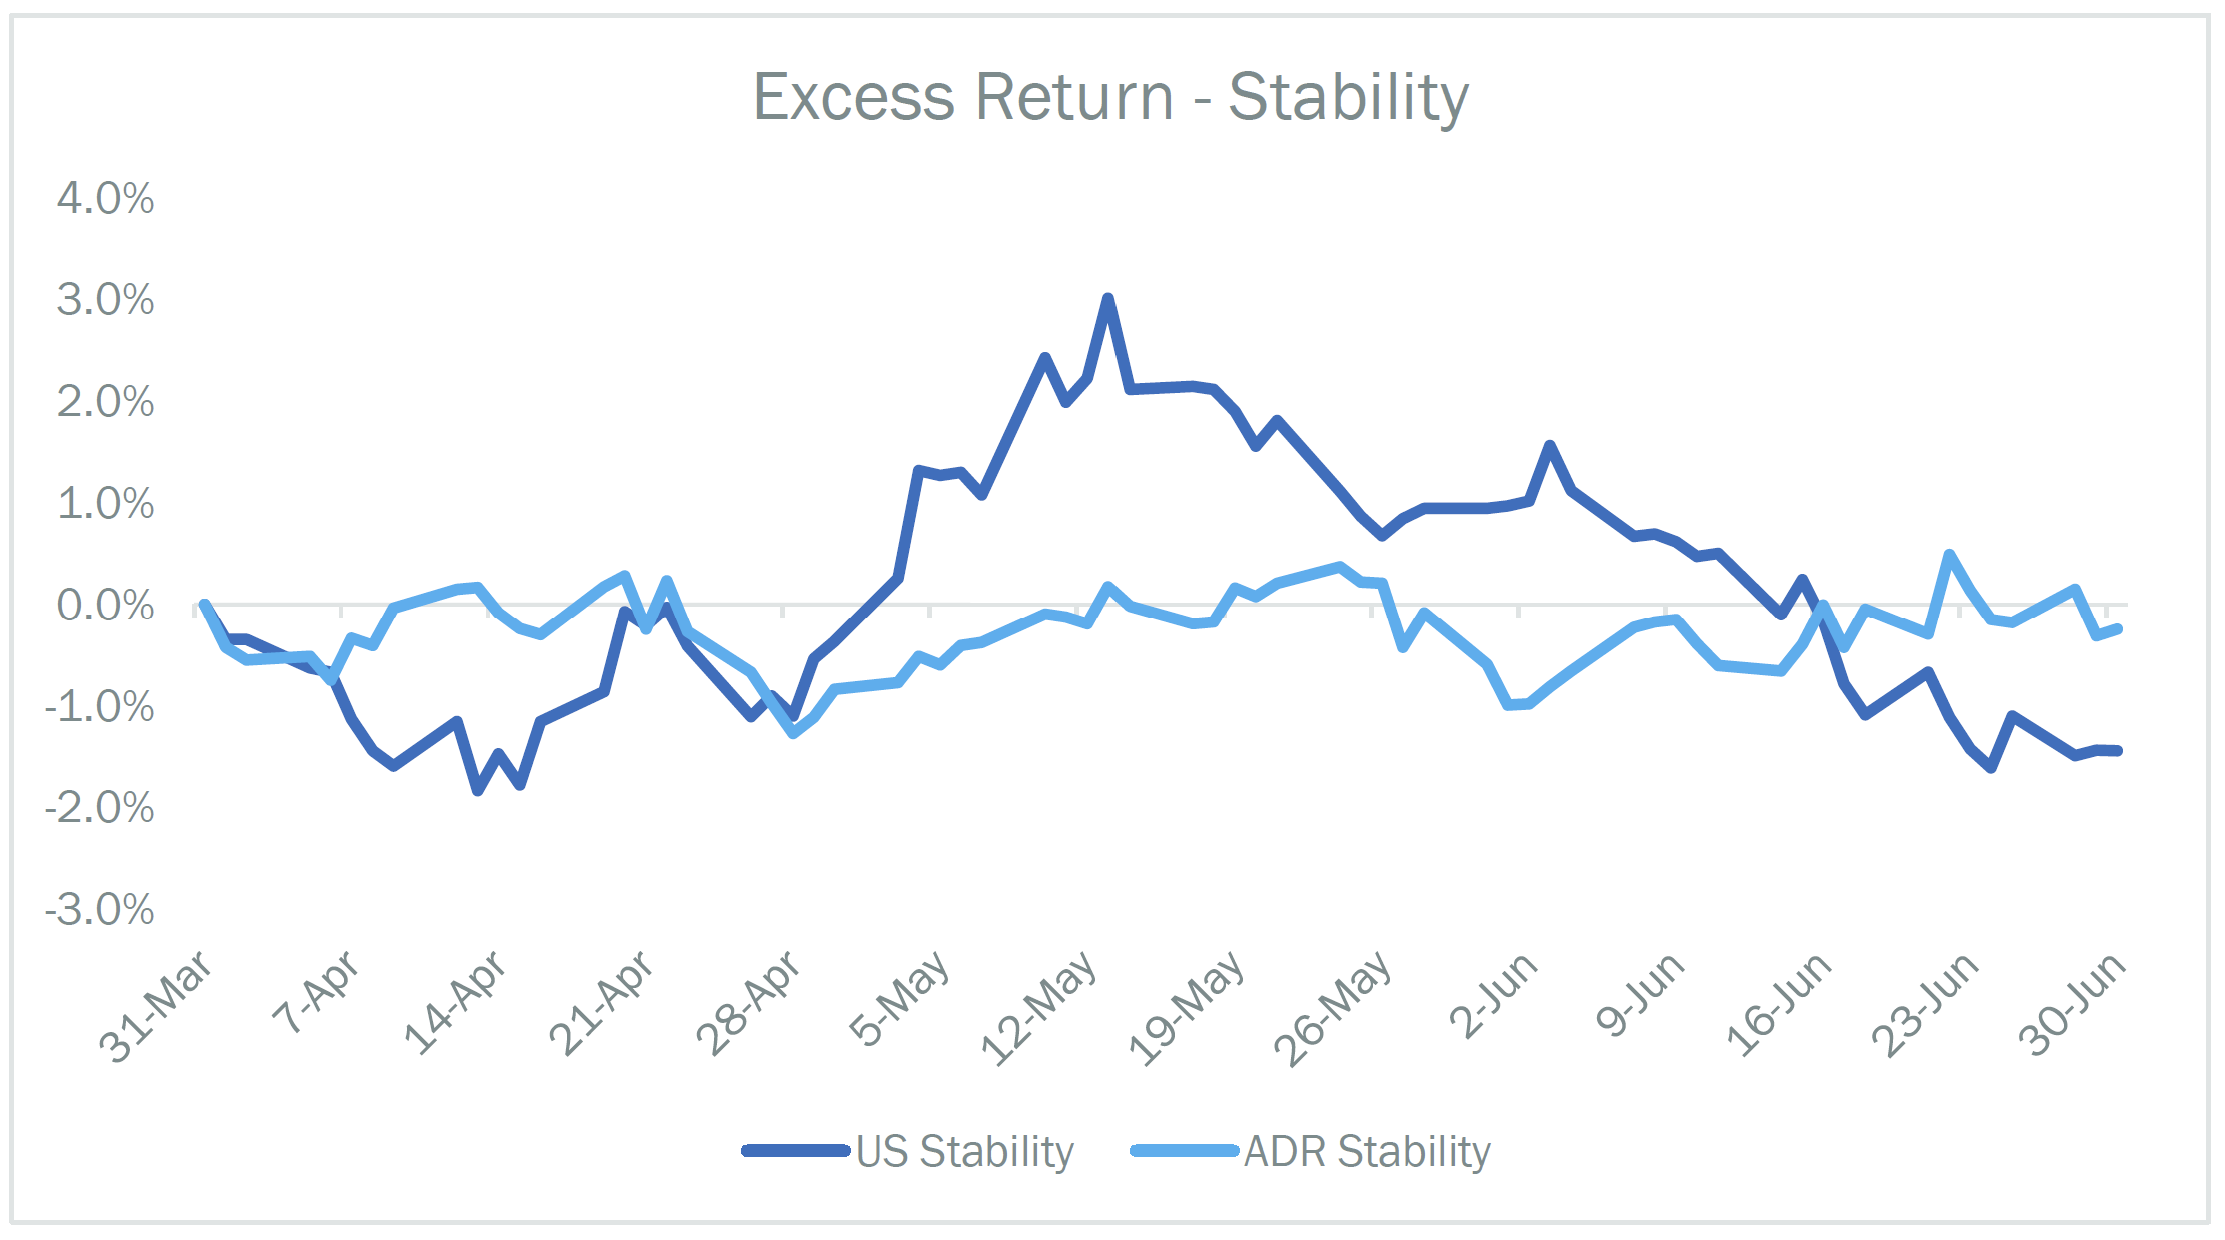
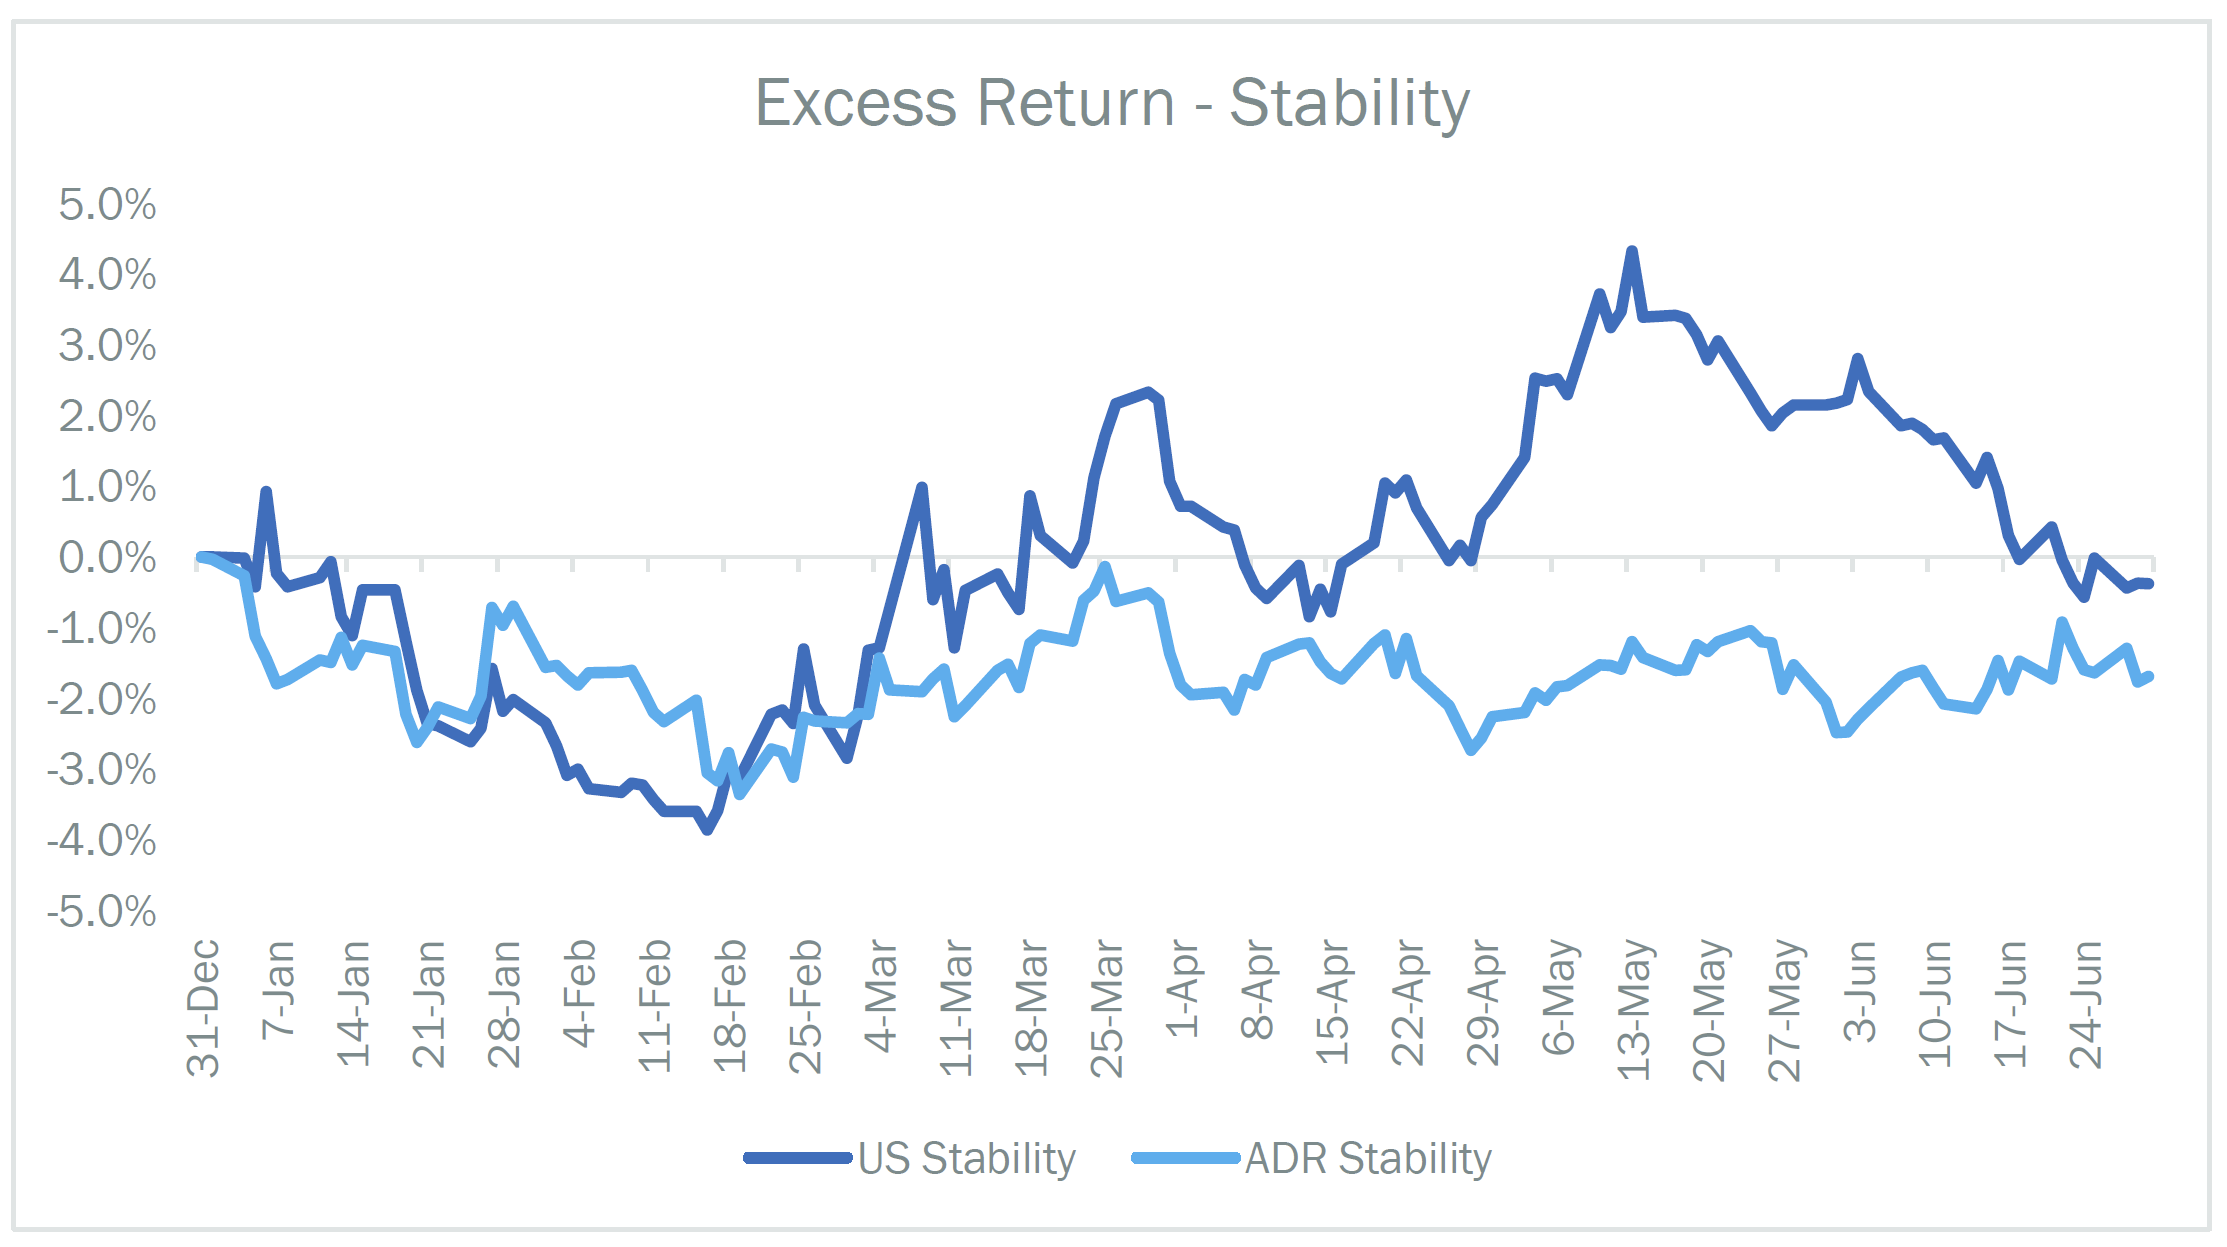
Our Stability theme identifies stocks with low volatility in sales, earnings, share issuance, and price volatility. A key feature of the theme is that it tends to offer strong relative downside protection in drawdowns. In “normal” environments, we would expect the strategy to keep pace with broad equities, and in strong up markets, we would expect the theme to lag. Over long periods of time, any “alpha” generated is likely via downside protection in downturns. Our Dividend Growth factor generates a similar return profile, but specifically seeks stocks with at least 5 year of consecutive annual dividend growth. Both themes generally experienced outperformance early in the year and gave back some of their gains versus benchmarks in June.
Current Positioning and Outlook
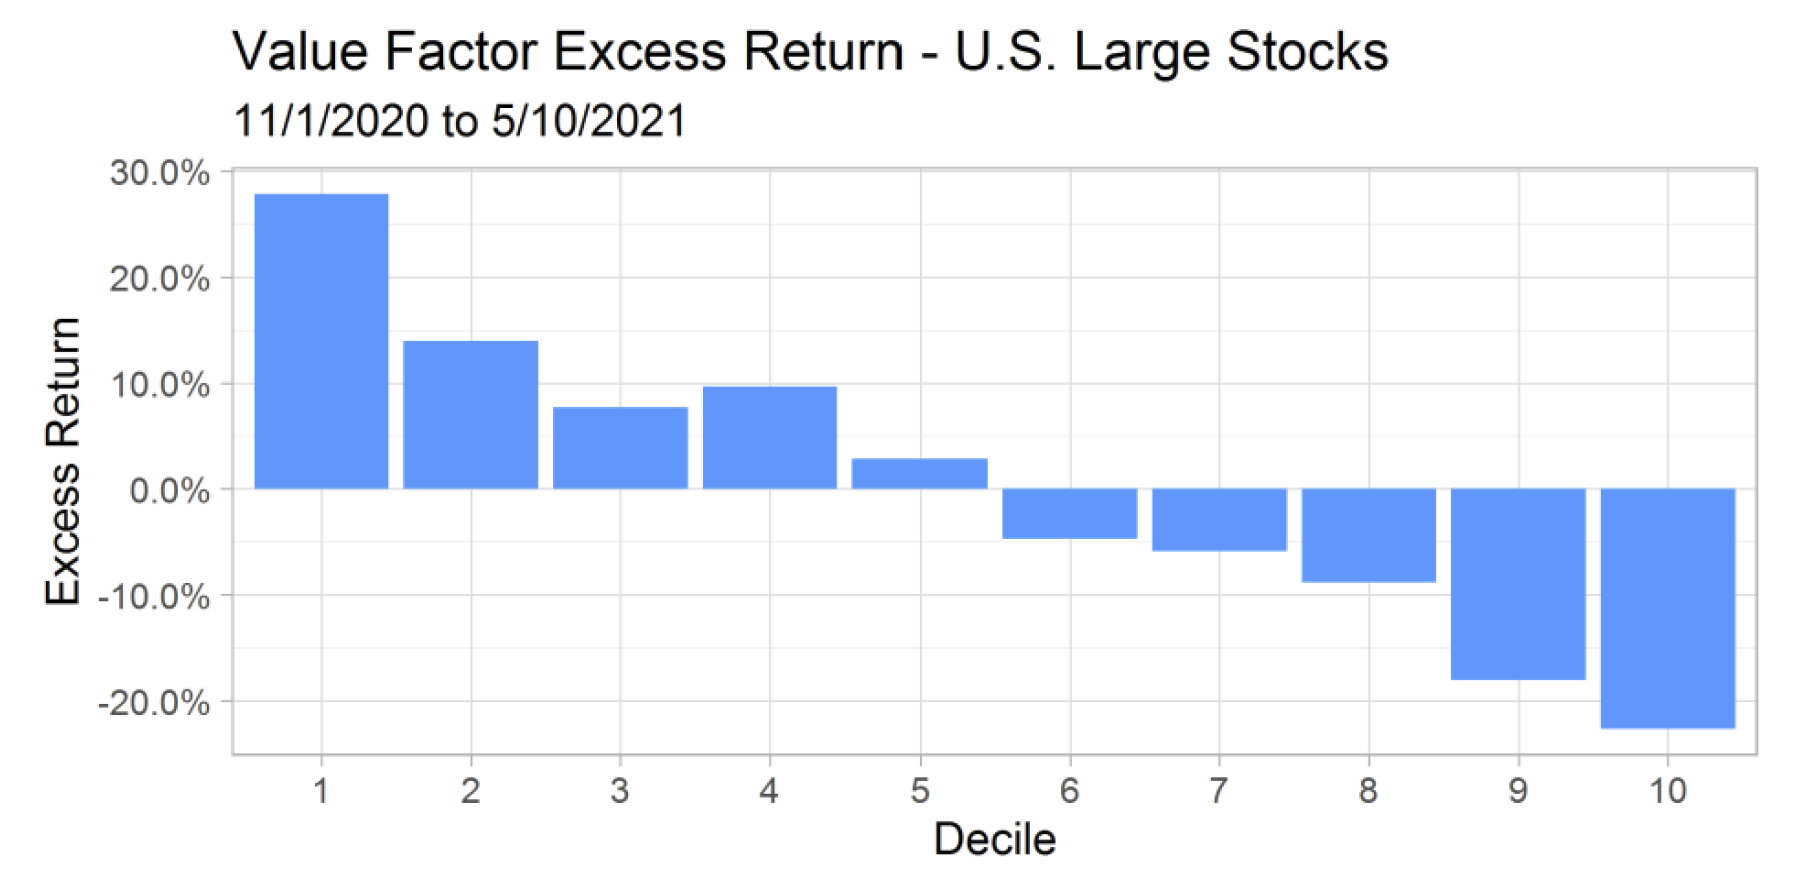
Value stocks seemingly emerged from their decade-long winter starting in November 2020 with multiple pivotal vaccine announcements. Cheap value (decile 1 below) dramatically outperformed expensive (decile 10) through May 10th by 50%.
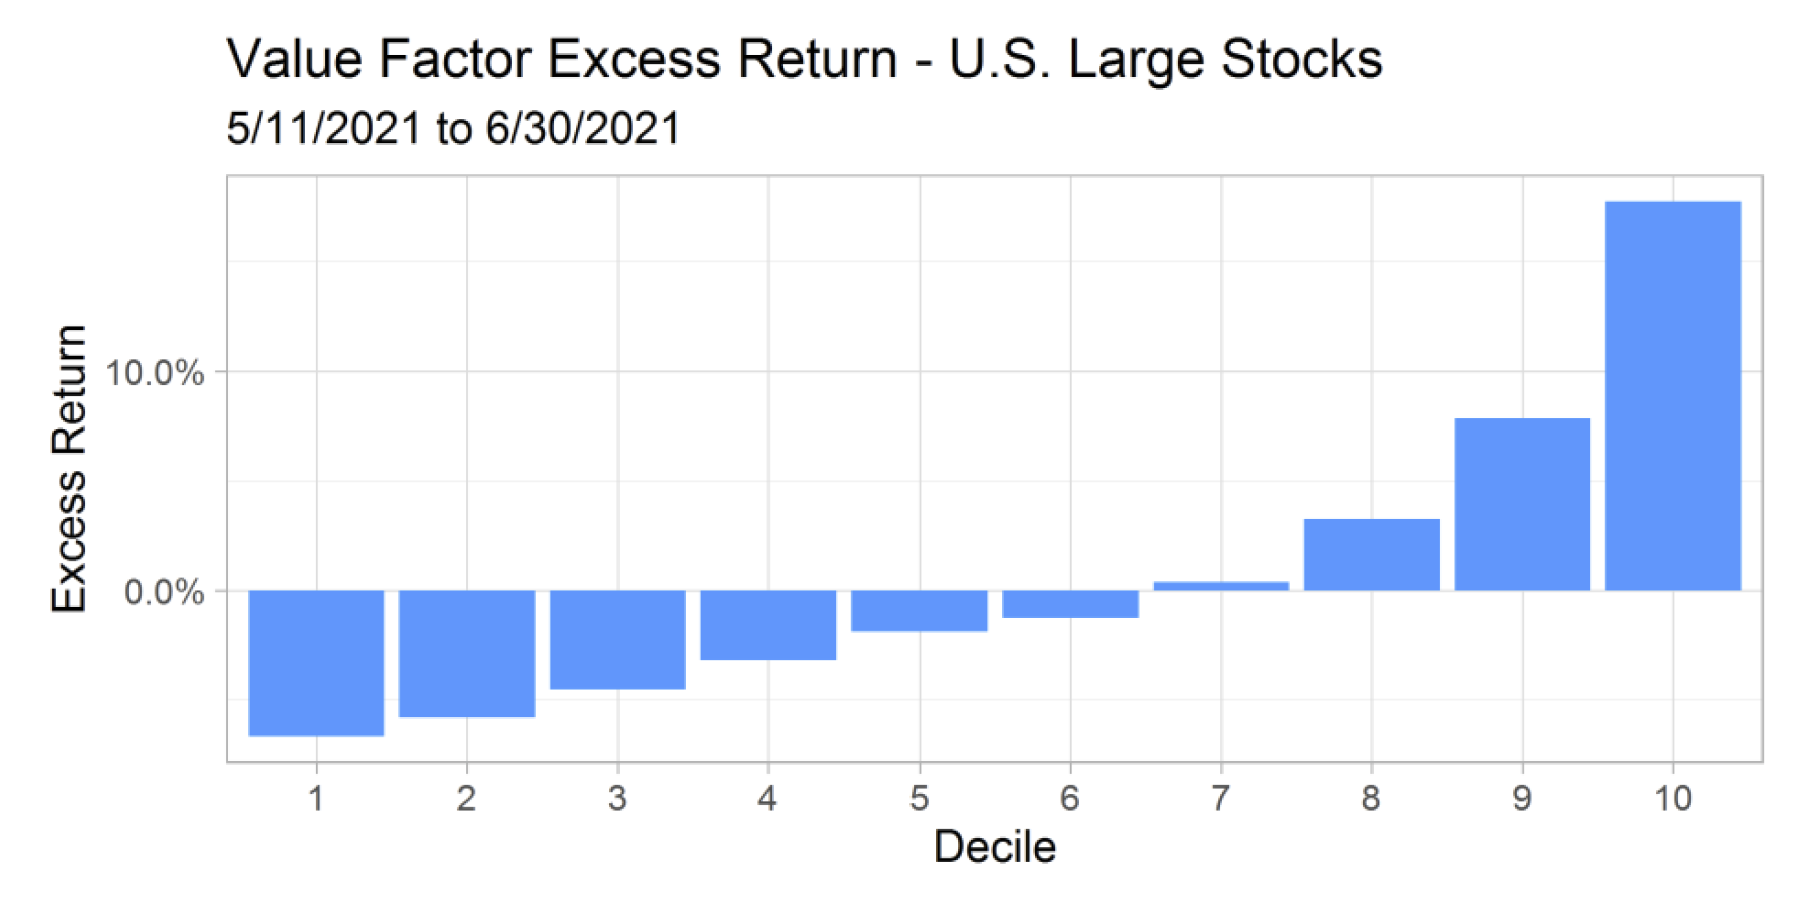
Then we received a massive disappointment in the April non-farm payrolls (NFP) release. This was the first real chink in value’s armor and resulted in a complete rethink of the reflation trade by investors. From May 11th through the end of the quarter, cheap value gave up half of its earlier gains to expensive stocks—underperforming by 24%.
To understand how this occurred, one only need review the sector allocations for cheap and expensive stocks below. We also add high Shareholder Yield to help explain its outperformance relative to cheap Value during the period.
The dominant sector allocation among cheap stocks coming into the COVID crisis were Financials, Industrials, Materials, Real Estate, and Energy. These cyclical sectors obviously all struggled, but also manifested in the reflation trade after the November vaccine announcements. Expensive stocks are dominated by Technology, Communication Services, and Health Care—assets that have served as the deflation/stay-at-home trade. As investors started to question the recovery in early May, the tech-heavy deflation trade again dominated.
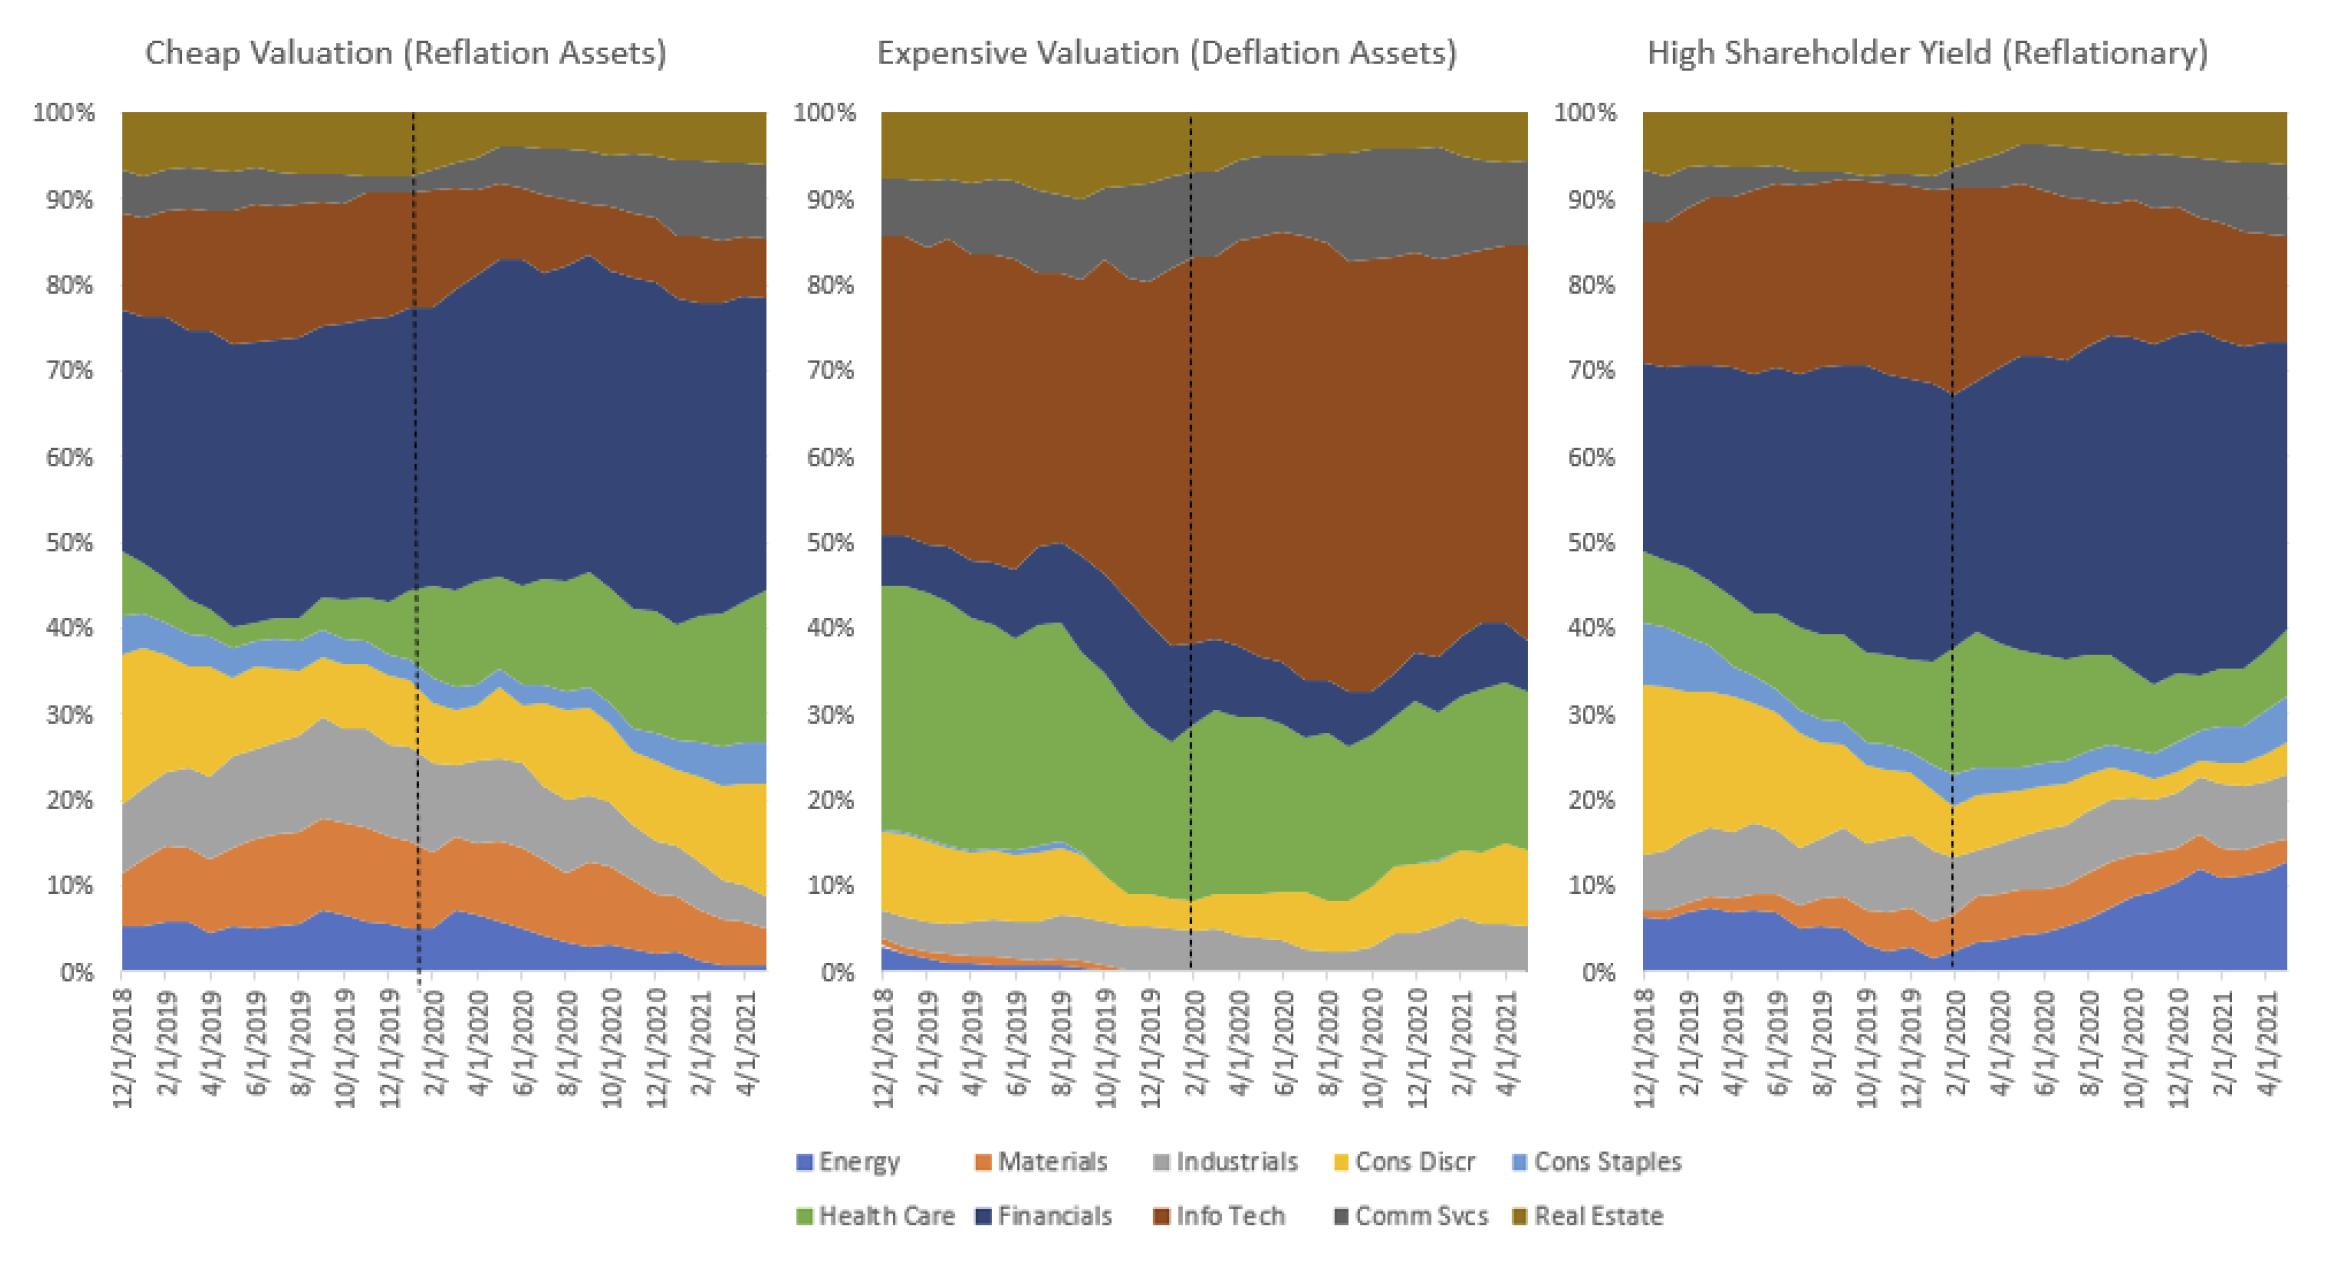
High Shareholder Yield generally tends to follow value, but with some differentiation. If Value is on the far left of a Morningstar style box and Growth is on the right, Shareholder Yield tends to sit left of center. Its more core than Value. We see that in the sector allocation above. While Shareholder Yield has hefty allocation to Financials, its lower than pure Value and it has a greater weight to defensive technology and reflationary Energy. On a relative basis, Shareholder Yield has had more of barbell approach to the recovery—a reflationary tilt, but with some defensive exposure. Because banks have been released from their capital constraints and announced large share buybacks, we would expect those allocations to grow as buybacks are executed.
As the market continues to digest Central Bank and fiscal policy, inflation, and corporate earnings performance, one can likely expect a seesaw in factor performance as data either confirms or questions the popular macro narrative—whatever that may be at the time.
While all of us have been forced to focus on macro themes, it’s easy to forget that corporations have mounted an incredible recovery. The first quarter, for example, sported the highest operating margin for the S&P 500 Index since at least 2006 at 13.02%.2 Q1 earnings increased 143% vs the comparable quarter in 2020 and 25% versus 2019 (pre-COVID). 1 year earnings growth for the MSCI ACWI ex US index was 33.9% as of 6/30. While earnings are bouncing back, raw valuations are rich relative to history. The S&P 500 is trading at 29x trailing twelve month (TTM) earnings and 22x 2021 estimates. Even though fundamentals have not mattered, in lieu of macro factors, it would be wise to keep them at top of mind.
FOOTNOTES
1 The Japanese Yield Curve has been flattening since February.
2 S&P Dow Jones Indices
GENERAL LEGAL DISCLOSURES & HYPOTHETICAL AND/OR BACKTESTED RESULTS DISCLAIMER
The material contained herein is intended as a general market commentary. Opinions expressed herein are solely those of O’Shaughnessy Asset Management, LLC and may differ from those of your broker or investment firm.
Please remember that past performance may not be indicative of future results. Different types of investments involve varying degrees of risk, and there can be no assurance that the future performance of any specific investment, investment strategy, or product (including the investments and/or investment strategies recommended or undertaken by O’Shaughnessy Asset Management, LLC), or any non-investment related content, made reference to directly or indirectly in this piece will be profitable, equal any corresponding indicated historical performance level(s), be suitable for your portfolio or individual situation, or prove successful. Due to various factors, including changing market conditions and/or applicable laws, the content may no longer be reflective of current opinions or positions. Moreover, you should not assume that any discussion or information contained in this piece serves as the receipt of, or as a substitute for, personalized investment advice from O’Shaughnessy Asset Management, LLC. Any individual account performance information reflects the reinvestment of dividends (to the extent applicable), and is net of applicable transaction fees, O’Shaughnessy Asset Management, LLC’s investment management fee (if debited directly from the account), and any other related account expenses. Account information has been compiled solely by O’Shaughnessy Asset Management, LLC, has not been independently verified, and does not reflect the impact of taxes on non-qualified accounts. In preparing this report, O’Shaughnessy Asset Management, LLC has relied upon information provided by the account custodian. Please defer to formal tax documents received from the account custodian for cost basis and tax reporting purposes. Please remember to contact O’Shaughnessy Asset Management, LLC, in writing, if there are any changes in your personal/financial situation or investment objectives for the purpose of reviewing/evaluating/revising our previous recommendations and/or services, or if you want to impose, add, or modify any reasonable restrictions to our investment advisory services. Please Note: Unless you advise, in writing, to the contrary, we will assume that there are no restrictions on our services, other than to manage the account in accordance with your designated investment objective. Please Also Note: Please compare this statement with account statements received from the account custodian. The account custodian does not verify the accuracy of the advisory fee calculation. Please advise us if you have not been receiving monthly statements from the account custodian. Historical performance results for investment indices and/or categories have been provided for general comparison purposes only, and generally do not reflect the deduction of transaction and/or custodial charges, the deduction of an investment management fee, nor the impact of taxes, the incurrence of which would have the effect of decreasing historical performance results. It should not be assumed that your account holdings correspond directly to any comparative indices. To the extent that a reader has any questions regarding the applicability of any specific issue discussed above to his/her individual situation, he/she is encouraged to consult with the professional advisor of his/her choosing. O’Shaughnessy Asset Management, LLC is neither a law firm nor a certified public accounting firm and no portion of the newsletter content should be construed as legal or accounting advice. A copy of the O’Shaughnessy Asset Management, LLC’s current written disclosure statement discussing our advisory services and fees is available upon request
The risk-free rate used in the calculation of Sortino, Sharpe, and Treynor ratios is 5%, consistently applied across time
The universe of All Stocks consists of all securities in the Chicago Research in Security Prices (CRSP) dataset or S&P Compustat Database (or other, as noted) with inflation-adjusted market capitalization greater than $200 million as of most recent year-end. The universe of Large Stocks consists of all securities in the Chicago Research in Security Prices (CRSP) dataset or S&P Compustat Database (or other, as noted) with inflation-adjusted market capitalization greater than the universe average as of most recent year-end. The stocks are equally weighted and generally rebalanced annually
Hypothetical performance results shown on the preceding pages are backtested and do not represent the performance of any account managed by OSAM, but were achieved by means of the retroactive application of each of the previously referenced models, certain aspects of which may have been designed with the benefit of hindsight
The hypothetical backtested performance does not represent the results of actual trading using client assets nor decision-making during the period and does not and is not intended to indicate the past performance or future performance of any account or investment strategy managed by OSAM. If actual accounts had been managed throughout the period, ongoing research might have resulted in changes to the strategy which might have altered returns. The performance of any account or investment strategy managed by OSAM will differ from the hypothetical backtested performance results for each factor shown herein for a number of reasons, including without limitation the following:
- Although OSAM may consider from time to time one or more of the factors noted herein in managing any account, it may not consider all or any of such factors. OSAM may (and will) from time to time consider factors in addition to those noted herein in managing any account.
- OSAM may rebalance an account more frequently or less frequently than annually and at times other than presented herein.
- OSAM may from time to time manage an account by using non-quantitative, subjective investment management methodologies in conjunction with the application of factors.
- The hypothetical backtested performance results assume full investment, whereas an account managed by OSAM may have a positive cash position upon rebalance. Had the hypothetical backtested performance results included a positive cash position, the results would have been different and generally would have been lower.
- The hypothetical backtested performance results for each factor do not reflect any transaction costs of buying and selling securities, investment management fees (including without limitation management fees and performance fees), custody and other costs, or taxes – all of which would be incurred by an investor in any account managed by OSAM. If such costs and fees were reflected, the hypothetical backtested performance results would be lower.
- The hypothetical performance does not reflect the reinvestment of dividends and distributions therefrom, interest, capital gains and withholding taxes.
- Accounts managed by OSAM are subject to additions and redemptions of assets under management, which may positively or negatively affect performance depending generally upon the timing of such events in relation to the market’s direction.
- Simulated returns may be dependent on the market and economic conditions that existed during the period. Future market or economic conditions can adversely affect the returns.
Please Note: Socially Responsible Investing Limitations. Socially Responsible Investing involves the incorporation of Environmental, Social and Governance considerations into the investment due diligence process (“ESG). There are potential limitations associated with allocating a portion of an investment portfolio in ESG securities (i.e., securities that have a mandate to avoid, when possible, investments in such products as alcohol, tobacco, firearms, oil drilling, gambling, etc.). The number of these securities may be limited when compared to those that do not maintain such a mandate. ESG securities could underperform broad market indices. Investors must accept these limitations, including potential for underperformance. Correspondingly, the number of ESG mutual funds and exchange traded funds are few when compared to those that do not maintain such a mandate. As with any type of investment (including any investment and/or investment strategies recommended and/or undertaken by OSAM), there can be no assurance that investment in ESG securities or funds will be profitable, or prove successful.


