Buybacks Bears and Bulls
By Chris Meredith
October 2016
A lot of attention has been paid to share repurchases recently, which makes sense given the amount of money involved. As of June 30, 2016, there had been almost $450 billion net transferred from companies to shareholders over the trailing 12-months through repurchase programs—very close to the all-time high in March 2008. Transferring that much wealth between stakeholders will garner attention, and not all of it is positive.
Buyback Bulls believe that repurchases are beneficial. Management is working in the best interest of its stakeholders and some companies have excess capital after all the operating costs and reinvestment in the business. There are different opportunities on how to deploy that excess capital: starting new projects, acquiring companies, and paying down debt. After reviewing all of these, the company decides its own equity is the best investment it can make. Bulls focus on the companies with the highest levels of repurchases, which have the highest conviction in their own equity.
Bears contend that stock repurchases are nothing more than financial engineering, a method for managers to prop up earnings per share and stock prices to meet analyst expectations and vest their options. The Bears make cogent arguments and appeal to the discontent of wealth distribution in our country. But most news articles— Bull or Bear perspective notwithstanding—offer little research or comprehensive data regarding whether buybacks are truly a manipulation of earnings or stock prices. This article explores the mechanics and effects of stock repurchase plans.
Earnings Manipulation
Earnings represent the amount of profit a company generates for shareholders and have become the benchmark for gauging the effectiveness of management. In an effort to align managers’ interests with shareholders, CEO compensation has shifted over time from cash salary and bonus to a mix of stock and options plus vesting schedules where stock and options comprise 55.6 percent of the compensation,1 with earnings per share (EPS) as one of the targets for vesting stock or options. Stock compensation also has some controversy around it because while it can incent managers towards positive activities to increase earnings distributed to the shareholders, it can also incent managers to manipulate earnings for short-term personal gain.
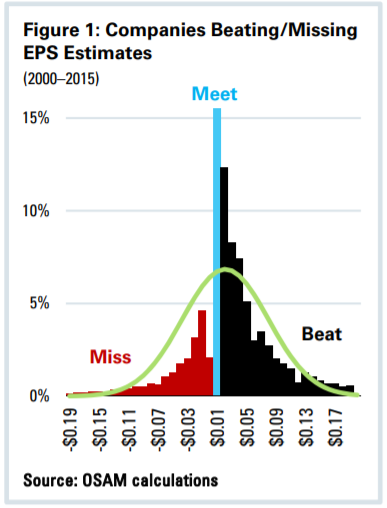
Let’s state the obvious: some companies manipulate earnings. Evidence shows companies are avoiding near misses. Figure 1 is a histogram showing the quarterly earnings versus the most recent consensus estimate for the Large Stocks Universe.2 Abnormally few companies are missing earnings by -$0.01 and there is a spike in companies that only match expectations. If managers were not manipulating earnings, we would expect a normal distribution with some just beating earnings, and some just missing. This is obviously not a normal distribution and is indicative that some companies are figuring out ways to make sure that they don’t fall short.
Companies try to beat earnings from both angles, managing down the analyst expectations3 as well as figuring out ways to boost EPS. There are two avenues for manipulating EPS: (a) inflating net income by recognizing revenue early or delaying expenses, or (b) repurchasing shares increasing the overall EPS through the denominator effect. The manipulation of net income is a whole report in itself but for this paper let’s just broadly state that companies boost income by adjusting the accounting treatment on non-cash items, accruals. We’re focused on answering the question whether the repurchase of shares is a positive activity for shareholders or just a manipulation earnings.
There is a lot of research available to help understand the mechanics of share repurchases. Hribar, Jenkins, and Johnson published an article in 2006 titled “Stock Repurchases as an Earnings Management Device” in the Journal of Accounting and Economics that did a great job detailing stock repurchases for earnings management. They examined the effect of share repurchases on stock price manipulation and show an interesting statistic:
“Within the sample of repurchasers, however, only 11.25 percent of the observations increase EPS by one cent or more. In contrast, 24.1 percent of the observed repurchases actually decrease EPS by one cent or more.”
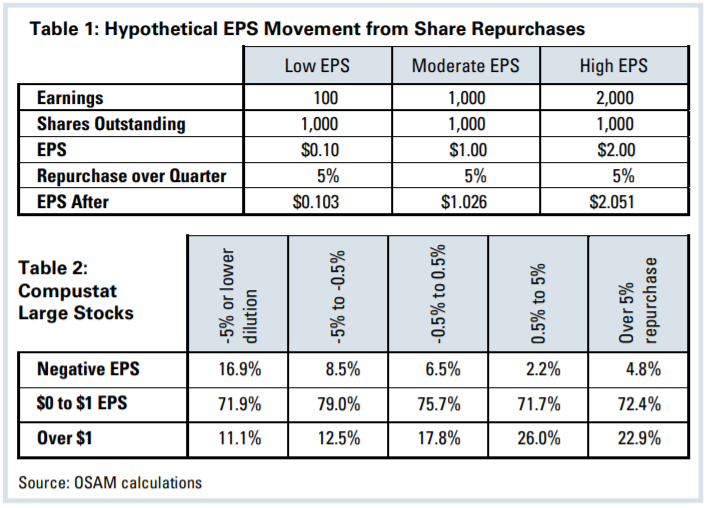
How is it possible that only 11 percent of the companies repurchasing shares are actually increasing EPS by one cent, and more than double the number of companies are actually decreasing EPS? Part of the explanation comes from how hard it is to manipulate earnings from the denominator. Let’s build a hypothetical example of a company with a thousand shares outstanding that is repurchasing five percent of its shares over the quarter, which is a pretty sizable amount that would normally land it in the top decile of repurchases. Table 1 demonstrates scenarios when earnings are at one hundred dollars, one thousand dollars, and two thousand dollars, which would give different levels of Earnings per Share at 10 cents, one dollar, and two dollars for the quarter. The scenario shows two things: (1) the effect of repurchases is muted because the earnings per share are calculated as the average shares over the entire quarter and (2) if you’re starting with a modest earnings per share, it’s difficult to move EPS—even by a penny. At ten cents per share, you would have to repurchase almost 20 percent of the company over the quarter to move it a penny. At one dollar EPS, a five percent repurchase has some effect but merely by two and three cents of earnings per share.
Table 2 shows the average EPS over this analysis period. The majority of companies have a low base of earnings per share to move from (between zero and a dollar). Companies with negative earning are slightly more likely to dilute, which makes sense because it would actually increase their negative EPS, bringing it closer to zero. And companies repurchasing more than five percent do have a higher average EPS but the majority still fall into the range where it’s not easy to move EPS through a share repurchase.
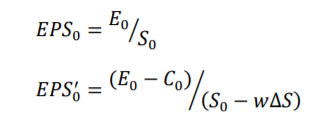
What was most surprising was the decrease in earnings from repurchases. While EPS does increase from the denominator effect of reducing shares, there is an offsetting effect from the benefit of cash. Hribar, et al. noted that cash does generate interest income, which contributes to EPS. So in order to calculate the full effect of a repurchase on earnings per share, both the time-weighted change in stock and also the reduction in interest income from cash need to be taken into account.
 In 2016, it’s hard for investors to recall that there was once a time when cash generated interest income. The article stated, “For example, if a firm earns five percent after taxes on cash…” This seemed to be a ludicrously high expected return on cash. But the article uses 1988–2001 as the sample period. The AA 3-month commercial paper (CP) is a decent proxy for the return on cash and over that time the average CP yield was 5.7 percent.
The “Stock Repurchases as an Earnings Management Device” article proceeds to demonstrate that any repurchases done where the return on cash is lower than the earnings yield actually decreases the earnings per share. To be explicit on this: when the earnings yield (the inverse of a P/E ratio) is higher than the return on cash, it is beneficial to shareholders for increasing EPS. When the return on cash is higher than the earnings yield, the EPS is decreased.
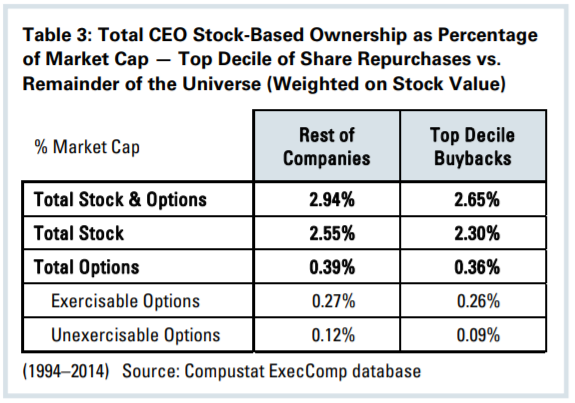
Few would argue that the goals of managers: CEOs are supposed to be increasing earnings per share. The difference between the Bulls and the Bears are the reasons for why management would be repurchasing stock. If stock-based compensation is the reason managers are repurchasing stock, it would make sense that companies with the strongest buybacks have the strongest repurchases. But looking at the Compustat ExecuComp database in combination with the Fundamental database, companies in the top 10 percent on buybacks in fact have lower CEO stock-based compensation than the rest of the universe. Table 3 shows that this holds true at the level of total stock-based compensation, just the stock ownership, as well as the options both exercisable and unexercisable.
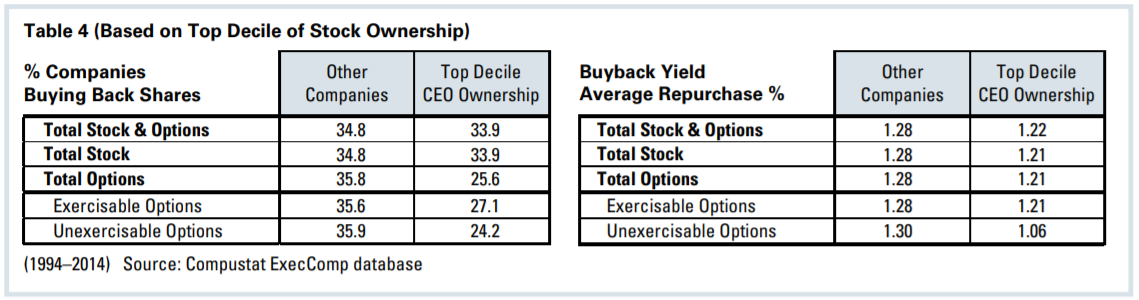
The analysis doesn’t support the case even when looking at it from the other direction: companies with the highest CEO stock-based ownership are not repurchasing more shares. Table 4 shows that, out of the companies where the CEO is owning a significant portion of the company (the average stock-based ownership was around 18 percent), a lower percentage of companies were repurchasing and, for those that did repurchase, the overall level of shares repurchased was less than other companies.
There has been a lot of commentary with regard to the historically high levels of share repurchases and, if it’s not the increase in stock-based compensation, then what is the reason for the increase in buyback programs? Regulation changes have contributed to this, as Safe Harbor legislation through SEC Rule 10b-18 in 1982 loosened the restrictions for when a company can repurchase stock. Do not underestimate the effect changes in regulation can have. On September 18, 2008—three days after Lehman filed for bankruptcy—the SEC loosened Rule 10b-18 such that there were no more restrictions on blackout periods and raised the percentage a company could participate in volume from 25 percent to 100 percent. This led to an 84-percent increase in buyback announcements October of 2008 over July of 2008.4
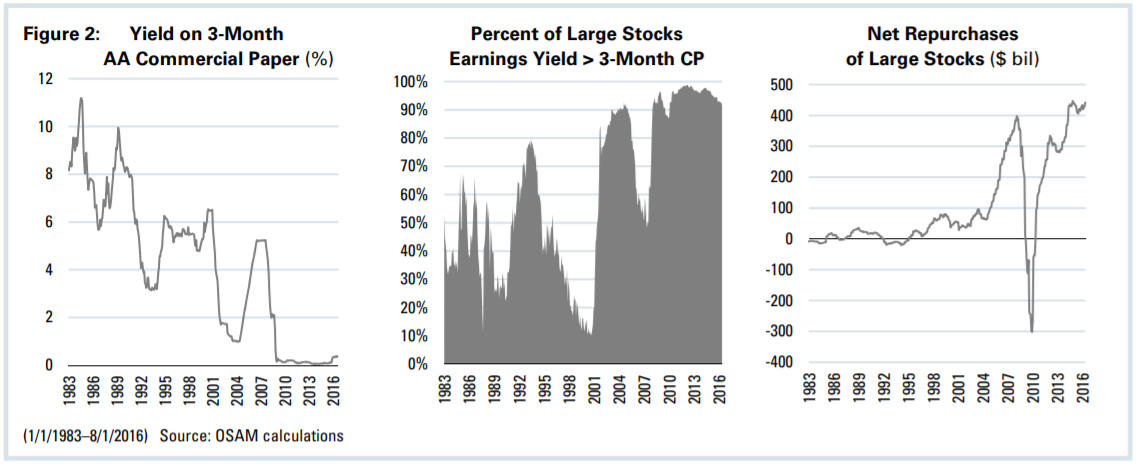
There is a more compelling reason why management is incented to repurchase stocks right now: historically low returns on cash. The “cost” of repurchasing shares in the EPS calculation is at a historical low because of suppressed interest rates. Figure 2 is a panel of three charts. The leftmost chart shows the yield on the three-month AA commercial paper, which has been close to zero since 2008. There was a significant decline over the entire period but, around 2001, there was a shift where interest rates dropped below two percent—meaning that, if a company has a P/E less than 50, then the repurchase of shares increases EPS for shareholders. The middle chart shows the percentage of companies in the Large Stocks Universe with an earnings yield higher than the yield and how there was a huge spike in 2002 in the percentage of companies for whom their EPS would benefit from a repurchase, settling in at over 90 percent of the companies since the financial crisis. The rightmost chart shows the overall level of net repurchases on a trailing 12-month basis within Large Stocks and how there is a corresponding spike in the overall volume of repurchases that coincides with the lower levels of return on cash. Maybe this is correlation and not causation but it makes sense that when 95 percent of the companies are able to increase their EPS by repurchases because of the historically low levels of return on cash, more of them are going to consider it.
Companies are managing to beat earnings more than miss. We are not sure whether those “bottom-line” beats are coming from accruals or the management of expectations, but it looks like few companies would have the ability to manipulate through repurchases given that most earnings per share are measured in cents rather than dollars. Even with those difficulties, repurchases may have a role in earnings management but that is outweighed by the long-term benefit buyback programs have given shareholders.
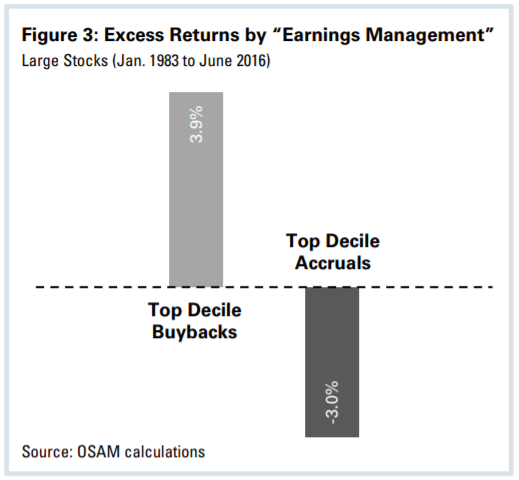
High conviction stock repurchase programs have generated significant excess returns historically. Figure 3 shows the excess returns broken into deciles for companies that are repurchasing shares compared to companies that are suppressing or boosting non-cash expenses relative to their peers. Companies repurchasing shares are rewarded in the marketplace, generating 3.9 percent annualized excess returns over a 33-year period. As a comparison, the same analysis is done based on earnings management through accruals. The top decile of companies boosting earnings by suppressing non-cash expenses are penalized by three percent. The difference in excess returns from strong repurchases indicates a different perception around the usage of accruals—a beneficial signal for investors rather than a mechanism to boost earnings.
Stock Price Manipulation
While the stocks with the strongest repurchases do have the strongest excess returns over time, Bears could argue these excess returns come from the manipulation of stock prices through the repurchases themselves.
William Lazonick’s article in the Harvard Business Review article “Profits Without Prosperity”5 made a strong case, wherein he makes the claim:
“Why are such massive resources being devoted to stock repurchases? Corporate executives give several reasons, which I will discuss later. But none of them has close to the explanatory power of this simple truth: Stock-based instruments make up the majority of their pay, and in the short term buybacks drive up stock prices.”
Lazonick’s statement about the majority of their pay coming from stock-based compensation is right. But is that compensation creating the reason for the buybacks? And are repurchases driving the stock price or are the excess returns from strong repurchases coming from the economic value creation of the company?
Repurchases aren’t influenced by the level of CEOs’ stock ownership but this does not refute the claim that repurchases are a form of stock price manipulation. In order to analyze this, we need a method to decompose the excess returns of companies with high repurchases to determine if the company’s demand for its own shares are driving the excess returns or if it’s the underlying value created by the business relative to its share price.
Buybacks are regulated by the SEC Rule 10b-18, which since 1982 has provided a “safe harbor” around how companies are allowed to repurchase shares. What the rule doesn’t do is provide immunity from Rule 10b-5, where they cannot repurchase shares while in possession of material non-public information. The majority of companies repurchase through open market operations. Since a company has a lot of material non-public information around their own stock, there are blackout periods when a company will not repurchase its own shares.
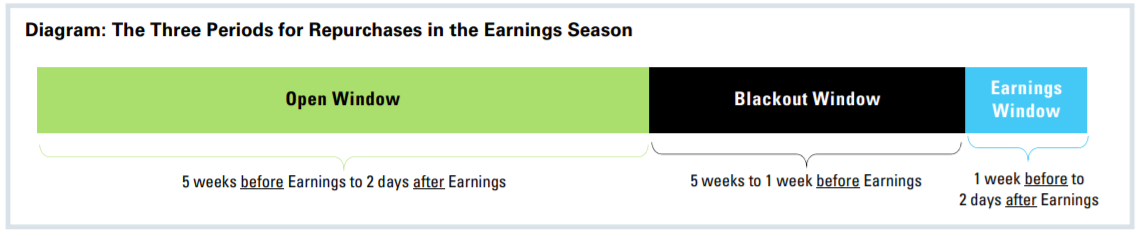
There is no standard period, although a typical cited practice is to avoid trading from five weeks before earnings to two days afterwards. This blackout period creates windows of time when the company is repurchasing its own shares alongside public investors and a separate window when it’s just the public trading.
Within this blackout window, there is also the release of the quarterly earnings, which is when new information about the financial health of the firm is introduced to the public. Earnings releases are big drivers of returns and this window can offer us a chance to look at the returns of the stock based on its operating business without the influence of share repurchases.
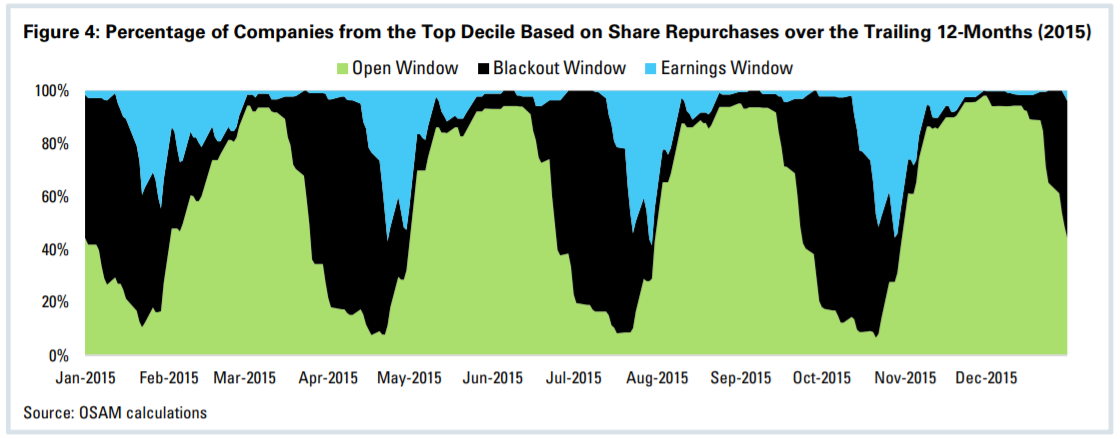
Not all earnings happen at the same time. The majority of them match fiscal quarters with calendar quarters, creating an earnings season. But some companies have off-quarter earnings cycles. Even within companies that have the same fiscal end dates, there are differences on when they report. The SEC allows 40 days for filing a 10-Q and 90 days on a 10-K, but some report earlier. Figure 4 shows the different windows when there are a lot of companies in a repurchase blackout and other periods of time where there are few companies in the blackout.
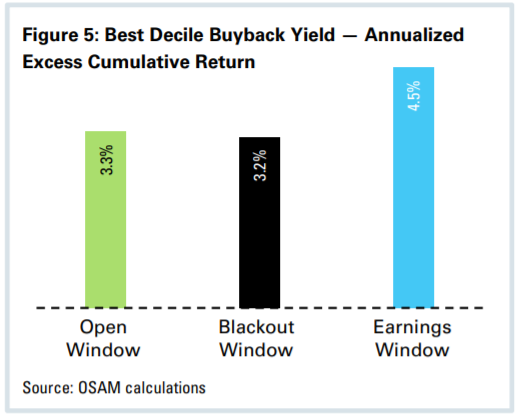
Given that there are different weights over different time periods, the appropriate way to calculate the drivers of the excess returns of each window is through the contribution to return. Without diving too much into the math, we can calculate how much each group is driving the four percent of excess performance from the top decile of companies. Because each window has different lengths of time, the appropriate way to compare them is to annualize the excess return from each window.
The results show that the annualized excess returns of stocks in the top decile and in the open window (+3.3 percent) are almost the same as the annualized excess returns of top decile stocks in the blackout window (+3.2 percent), and the highest period of annualized excess return comes through the earnings window, the seven days around the earnings announce-ment. This indicates that the excess returns from stocks that are repurchasing stocks are driven not from the stock repurchases, but rather from the information coming from earnings reports—the underlying economic value generation of the companies.
SUMMARY
Buybacks can be expected to continue at high rates so long as interest rates continue to be lower than the earnings yields of companies and will continue to garner accusations that CEOs are manipulating earnings and stock prices to line their own pockets. But the data offers stronger support for the claims that buyback programs on average generate long-term excess returns for shareholders, driven by the earnings of the companies. It does not mean every buyback program is done for the same reason—and surely that some managers are repurchasing shares to try and manipulate earnings while thinking about their options—but the majority of the repurchase programs are beneficial to investors.
In order to utilize buybacks as an investment signal, use the old President Reagan maxim of “Trust, but verify.” Use buybacks in combination with value to confirm management’s reasons for the repurchase and to ensure that management is repurchasing at a discount. Use accruals to make sure that management isn’t manipulating earnings through the numerator, which could indicate their motives for the denominator as well. Use earnings growth to ensure there is organic growth on top of the EPS consolidation. When used collectively, these can give a comprehensive look into a company and allow investors to use stock buybacks as a signal for wise investments.
Footnotes:
1 Total compensation numbers calculated from CEOs in 2014 in the Compustat ExecuComp database.
2 Compustat Large Stocks are all the stocks domiciled and traded in the U.S. with a market capitalization greater than the universe average. Stocks in this analysis also require coverage in the IBES universe.
3 See http://www.wsj.com/articles/companies-routinely-steer-analysts-to-deliver-earnings-surprises-1470326310
4 Griffin, Paul A. and Zhu, Ning, “Accounting Rules? Stock Buybacks and Stock Options: Additional Evidence” (December 31, 2009). UC Davis Graduate School of Management Research Paper No. 08-09.
5 See https://hbr.org/2014/09/profits-without-prosperity/
General Legal Disclosures & Hypothetical and/or Backtested Results Disclaimer
The material contained herein is intended as a general market commentary. Opinions expressed herein are solely those of O’Shaughnessy Asset Management, LLC and may differ from those of your broker or investment firm.
Please remember that past performance may not be indicative of future results. Different types of investments involve varying degrees of risk, and there can be no assurance that the future performance of any specific investment, investment strategy, or product (including the investments and/or investment strategies recommended or undertaken by O’Shaughnessy Asset Management, LLC), or any non-investment related content, made reference to directly or indirectly in this piece will be profitable, equal any corresponding indicated historical performance level(s), be suitable for your portfolio or individual situation, or prove successful. Due to various factors, including changing market conditions and/or applicable laws, the content may no longer be reflective of current opinions or positions. Moreover, you should not assume that any discussion or information contained in this piece serves as the receipt of, or as a substitute for, personalized investment advice from O’Shaughnessy Asset Management, LLC. Any individual account performance information reflects the reinvestment of dividends (to the extent applicable), and is net of applicable transaction fees, O’Shaughnessy Asset Management, LLC’s investment management fee (if debited directly from the account), and any other related account expenses. Account information has been compiled solely by O’Shaughnessy Asset Management, LLC, has not been independently verified, and does not reflect the impact of taxes on non-qualified accounts. In preparing this report, O’Shaughnessy Asset Management, LLC has relied upon information provided by the account custodian. Please defer to formal tax documents received from the account custodian for cost basis and tax reporting purposes. Please remember to contact O’Shaughnessy Asset Management, LLC, in writing, if there are any changes in your personal/financial situation or investment objectives for the purpose of reviewing/evaluating/revising our previous recommendations and/or services, or if you want to impose, add, or modify any reasonable restrictions to our investment advisory services. Please Note: Unless you advise, in writing, to the contrary, we will assume that there are no restrictions on our services, other than to manage the account in accordance with your designated investment objective. Please Also Note: Please compare this statement with account statements received from the account custodian. The account custodian does not verify the accuracy of the advisory fee calculation. Please advise us if you have not been receiving monthly statements from the account custodian. Historical performance results for investment indices and/or categories have been provided for general comparison purposes only, and generally do not reflect the deduction of transaction and/or custodial charges, the deduction of an investment management fee, nor the impact of taxes, the incurrence of which would have the effect of decreasing historical performance results. It should not be assumed that your account holdings correspond directly to any comparative indices. To the extent that a reader has any questions regarding the applicability of any specific issue discussed above to his/her individual situation, he/she is encouraged to consult with the professional advisor of his/her choosing. O’Shaughnessy Asset Management, LLC is neither a law firm nor a certified public accounting firm and no portion of the newsletter content should be construed as legal or accounting advice. A copy of the O’Shaughnessy Asset Management, LLC’s current written disclosure statement discussing our advisory services and fees is available upon request.
The risk-free rate used in the calculation of Sortino, Sharpe, and Treynor ratios is 5%, consistently applied across time.
The universe of All Stocks consists of all securities in the Chicago Research in Security Prices (CRSP) dataset or S&P Compustat Database (or other, as noted) with inflation-adjusted market capitalization greater than $200 million as of most recent year-end. The universe of Large Stocks consists of all securities in the Chicago Research in Security Prices (CRSP) dataset or S&P Compustat Database (or other, as noted) with inflation-adjusted market capitalization greater than the universe average as of most recent year-end. The stocks are equally weighted and generally rebalanced annually.
Hypothetical performance results shown on the preceding pages are backtested and do not represent the performance of any account managed by OSAM, but were achieved by means of the retroactive application of each of the previously referenced models, certain aspects of which may have been designed with the benefit of hindsight.
The hypothetical backtested performance does not represent the results of actual trading using client assets nor decision-making during the period and does not and is not intended to indicate the past performance or future performance of any account or investment strategy managed by OSAM. If actual accounts had been managed throughout the period, ongoing research might have resulted in changes to the strategy which might have altered returns. The performance of any account or investment strategy managed by OSAM will differ from the hypothetical backtested performance results for each factor shown herein for a number of reasons, including without limitation the following:
- Although OSAM may consider from time to time one or more of the factors noted herein in managing any account, it may not consider all or any of such factors. OSAM may (and will) from time to time consider factors in addition to those noted herein in managing any account.
- OSAM may rebalance an account more frequently or less frequently than annually and at times other than presented herein.
- OSAM may from time to time manage an account by using non-quantitative, subjective investment management methodologies in conjunction with the application of factors.
- The hypothetical backtested performance results assume full investment, whereas an account managed by OSAM may have a positive cash position upon rebalance. Had the hypothetical backtested performance results included a positive cash position, the results would have been different and generally would have been lower.
- The hypothetical backtested performance results for each factor do not reflect any transaction costs of buying and selling securities, investment management fees (including without limitation management fees and performance fees), custody and other costs, or taxes – all of which would be incurred by an investor in any account managed by OSAM. If such costs and fees were reflected, the hypothetical backtested performance results would be lower.
- The hypothetical performance does not reflect the reinvestment of dividends and distributions therefrom, interest, capital gains and withholding taxes.
- Accounts managed by OSAM are subject to additions and redemptions of assets under management, which may positively or negatively affect performance depending generally upon the timing of such events in relation to the market’s direction.
- Simulated returns may be dependent on the market and economic conditions that existed during the period. Future market or economic conditions can adversely affect the returns.


