An Update From OSAM
By Patrick O’Shaughnessy
March 2020
March 10, 2020
OSAM clients,
Like everyone we are watching markets and the coronavirus carefully and thinking of ways to be safe and helpful. In acutely painful markets, we have two goals.
First, to execute our firm’s strategies as flawlessly as we can with a clear emphasis on trading and portfolio management, risk management and rebalancing, and client communication.
Second, to keep our employees safe, secure, and supported and to do the same for clients to the extent we can, by making their jobs easier if possible. This includes any information or reporting that we can muster that provides perspective for clients. If we can do something to help, tell us.
In the spirit of sharing information, we provide some very simple looks inside the market below (with data through and including the dramatic sell-off on March 9th).
Factor Performance
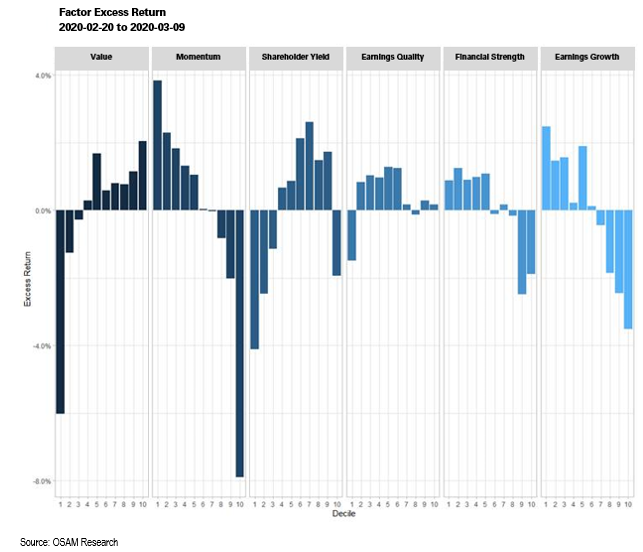
Value has continued its terrible run of performance, dragging many quantitative strategies, ours included. Value strategies that are heavily exposed to Energy and Bank stocks will be the hardest hit, which highlights the need for smart diversification within a factor-based strategy. We’ve always advocated a diversified factor approach, which is helping in this period—but value’s poor performance has taken its toll. Luckily, quality factors have helped especially those which focus on avoiding companies with overleveraged balance sheets and poor earnings trends (right-most two charts below).
Here are factor returns since the market peak in late February through March 9th.
Markets
We maintain several models internally which serve as guideposts for future market returns. We don’t think that equity returns can be predicted with any real accuracy over horizons less than 5 years, and 10-year projections are much more stable (and still hugely imperfect). Still these models are helpful reminders because they use business fundamentals and market prices as their primary inputs. They don’t take news into account (which is both a strength and a weakness). Both models have changed considerably in recent weeks.
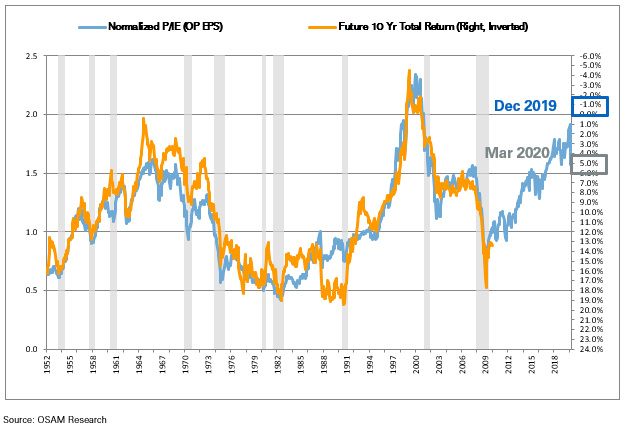
Price-to-Integrated-Equity
Our price/integrated equity (PIE) return prediction now forecasts a 10-year return of 5%/year for U.S. stocks. That is up massively from the 1%/year prediction as of the end of 2019. The model is very simple: it compares market price to “integrated equity,” which is a growing and inflation adjusted measure of retained earnings. Think of it like a better, cleaner book value. This model is built to not “overreact” to recent changes in corporate earnings, so even when near term earnings take a serious hit as a result of the virus + oil market moves, our return prediction will likely continue to look more attractive now than at the end of last year.
We also maintain a second internal model which we call “machine valuation,” developed by our co-CIO Chris Meredith and his team. The model is designed to “predict” today’s market value for every company in the U.S. (and therefore broad indexes as well). Think of it as a model to calculate our view of intrinsic value. We can then compare our estimation of intrinsic value with actual market values. We compare the two in the charts below. We will elaborate on these models in a future paper.
For the Russell 1000, you can see the market has appeared overvalued for some time (mostly because of growth stocks) but that the gap has narrowed considerably in the last month. Perhaps more interesting, the Russell 1000 Value is now trading below our estimate of intrinsic value, while Growth remains considerably elevated.
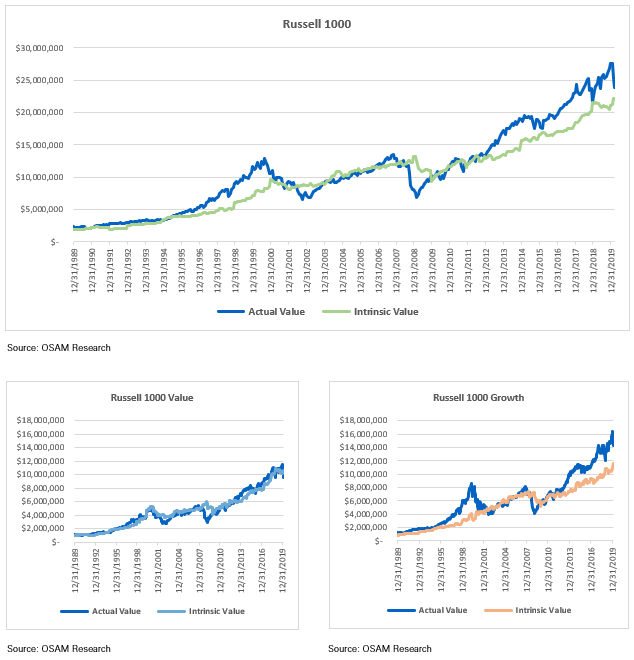
Again, models like this are by no means perfect. We offer them here not to say, “don’t panic,” because in the short-term prices are unpredictable and may continue sharply lower. Instead we share these models to highlight that with a long investing horizon, odds are that prices today will lead to better returns than were available just two months ago.
Focus
We will be using off-market hours to gather and share as much information as we can across topics and asset classes. I personally will release conversations in podcast format with experts from Oil & Gas, corporate credit, and venture capital in the coming days to share what people are seeing on the front lines.
Most investors have a long-term allocation to stocks because of the overwhelming historical evidence in favor of such an allocation. Our desire to “do something” in a crisis, to offer a port in the storm, is only human. It is during crises when systems and processes tend to break, so while our systems are built for this, our primary focus is taking extra care on execution and support.
Patrick
Chief Executive Officer and Portfolio Manager
General Legal Disclosures & Hypothetical and/or Backtested Results Disclaimer
The material contained herein is intended as a general market commentary. Opinions expressed herein are solely those of O’Shaughnessy Asset Management, LLC and may differ from those of your broker or investment firm.
Please remember that past performance may not be indicative of future results. Different types of investments involve varying degrees of risk, and there can be no assurance that the future performance of any specific investment, investment strategy, or product (including the investments and/or investment strategies recommended or undertaken by O’Shaughnessy Asset Management, LLC), or any non-investment related content, made reference to directly or indirectly in this piece will be profitable, equal any corresponding indicated historical performance level(s), be suitable for your portfolio or individual situation, or prove successful. Due to various factors, including changing market conditions and/or applicable laws, the content may no longer be reflective of current opinions or positions. Moreover, you should not assume that any discussion or information contained in this piece serves as the receipt of, or as a substitute for, personalized investment advice from O’Shaughnessy Asset Management, LLC. Any individual account performance information reflects the reinvestment of dividends (to the extent applicable), and is net of applicable transaction fees, O’Shaughnessy Asset Management, LLC’s investment management fee (if debited directly from the account), and any other related account expenses. Account information has been compiled solely by O’Shaughnessy Asset Management, LLC, has not been independently verified, and does not reflect the impact of taxes on non-qualified accounts. In preparing this report, O’Shaughnessy Asset Management, LLC has relied upon information provided by the account custodian. Please defer to formal tax documents received from the account custodian for cost basis and tax reporting purposes. Please remember to contact O’Shaughnessy Asset Management, LLC, in writing, if there are any changes in your personal/financial situation or investment objectives for the purpose of reviewing/evaluating/revising our previous recommendations and/or services, or if you want to impose, add, or modify any reasonable restrictions to our investment advisory services. Please Note: Unless you advise, in writing, to the contrary, we will assume that there are no restrictions on our services, other than to manage the account in accordance with your designated investment objective. Please Also Note: Please compare this statement with account statements received from the account custodian. The account custodian does not verify the accuracy of the advisory fee calculation. Please advise us if you have not been receiving monthly statements from the account custodian. Historical performance results for investment indices and/or categories have been provided for general comparison purposes only, and generally do not reflect the deduction of transaction and/or custodial charges, the deduction of an investment management fee, nor the impact of taxes, the incurrence of which would have the effect of decreasing historical performance results. It should not be assumed that your account holdings correspond directly to any comparative indices. To the extent that a reader has any questions regarding the applicability of any specific issue discussed above to his/her individual situation, he/she is encouraged to consult with the professional advisor of his/her choosing. O’Shaughnessy Asset Management, LLC is neither a law firm nor a certified public accounting firm and no portion of the newsletter content should be construed as legal or accounting advice. A copy of the O’Shaughnessy Asset Management, LLC’s current written disclosure statement discussing our advisory services and fees is available upon request.
Hypothetical performance results shown on the preceding pages are backtested and do not represent the performance of any account managed by OSAM, but were achieved by means of the retroactive application of each of the previously referenced models, certain aspects of which may have been designed with the benefit of hindsight.
The hypothetical backtested performance does not represent the results of actual trading using client assets nor decision-making during the period and does not and is not intended to indicate the past performance or future performance of any account or investment strategy managed by OSAM. If actual accounts had been managed throughout the period, ongoing research might have resulted in changes to the strategy which might have altered returns. The performance of any account or investment strategy managed by OSAM will differ from the hypothetical backtested performance results for each factor shown herein for a number of reasons, including without limitation the following:
▪ Although OSAM may consider from time to time one or more of the factors noted herein in managing any account, it may not consider all or any of such factors. OSAM may (and will) from time to time consider factors in addition to those noted herein in managing any account.
▪ OSAM may rebalance an account more frequently or less frequently than annually and at times other than presented herein.
▪ OSAM may from time to time manage an account by using non-quantitative, subjective investment management methodologies in conjunction with the application of factors.
▪ The hypothetical backtested performance results assume full investment, whereas an account managed by OSAM may have a positive cash position upon rebalance. Had the hypothetical backtested performance results included a positive cash position, the results would have been different and generally would have been lower.
▪ The hypothetical backtested performance results for each factor do not reflect any transaction costs of buying and selling securities, investment management fees (including without limitation management fees and performance fees), custody and other costs, or taxes – all of which would be incurred by an investor in any account managed by OSAM. If such costs and fees were reflected, the hypothetical backtested performance results would be lower. Therefore, it should be noted that on the previous pages of this presentation, any back-tested results may be reflected gross of fees. Had OSAM managed the back-tested Portfolio during the corresponding time period, the deduction of an OSAM fee would have decreased the reflected results. For example, the deduction of a 1.00% fee over a 10-year period would have reduced a 10% gross of fees gain to an 8.9% net of fees gain.
▪ The hypothetical performance does not reflect the reinvestment of dividends and distributions therefrom, interest, capital gains and withholding taxes.
▪ Accounts managed by OSAM are subject to additions and redemptions of assets under management, which may positively or negatively affect performance depending generally upon the timing of such events in relation to the market’s direction.
▪ Simulated returns may be dependent on the market and economic conditions that existed during the period. Future market or economic conditions can adversely affect the returns.
Composite Performance Summary
For full composite performance summaries. please follow this link: http://www.osam.com
O’Shaughnessy Asset Management – Canvas™ Disclosures
O’SHAUGHNESSY ASSET MANAGEMENT, L.L.C.


