"Learn, build, share, repeat" is a simple process that we apply to investing.
"Learn" means keep pushing to understand what we don't already know. This includes reading, reasoning, exploring data, having conversations, testing hypotheses, and respecting evidence. We believe you are either learning and growing, or you are already in decline.
"Build" is our forcing function. By requiring ourselves to transform raw information into something our own, we can create unique and useful products for others. We build highly systematic, and therefore repeatable, investment strategies. These strategies serve as perfect vessels to contain what we've uncovered in our research. We are practitioners at heart.
"Share" means connection. Sharing openly and transparently creates a feedback loop that improves what we are building. It also creates a community of like-minded people with similar values and curiosities. We share everything we can that doesn't infringe on our investing edge via research papers, podcasts, events, conversations, and other media. You can follow along here.
"Repeat" emphasizes that this is a mission which is never complete. We are committed to the process itself. We won't ever stop.
We believe that this process, applied diligently over time, will benefit three sets of stakeholders: 1) our clients, first and foremost, 2) our OSAM colleagues, and 3) the broader investment community.
Our Clients — Through three decades, we've learned with our clients. We are always striving to improve the capacity of our platform—which includes our data, our proprietary research and portfolio management technologies, and a highly experienced team. Our goal is to deploy this platform for our clients' long-term benefit. More than half of our strategies were created because of a client request. We'd love to discuss how it works with you.
Our Colleagues — Our culture is one of curiosity. We hire and promote people driven by a need to understand investing, markets, and our industry, and who want to share the excitement of that process with others. Our goal is to bring together a group of knowledge seekers, who enjoy learning and always act with kindness and integrity. If you love markets and are looking for an open environment of ideas, let us know.
SIGN UP FOR OSAM RESEARCH
Sign up to receive a monthly email summary of both our research and the best of what we learned from others.
SUBSCRIBE
The Investment Community —by sharing most of what we learn, we hope to help investors of all types make better and more informed decisions, and ultimately build better portfolios. Experience has taught us that constant exploration is contagious. Through a commitment to education we hope to improve the investing discourse globally.
So long as the firm itself is an active classroom and laboratory, we are confident we can help clients achieve their investing goals, help our colleagues develop new skills and modes of understanding, and help all investors better understand what makes markets tick.
This all feeds into our investing process, which is the primary way we "build" something useful.
Investment Process
Our central finding across three decades of empirical work is that factors drive long-term returns. Our investment model, detailed below, is the result of 20 years of research and refinement. We use this common framework striving to build portfolios with significant factor advantages. We tailor this general model for different style, geographic, and size segments of the market to meet specific client needs.
We get into detail below, but simply put, we:
Gather data on companies
Turn that data into custom factors that can be used to evaluate each stock, and
Use those factors to build a portfolio with the highest ranking factor profiles while also managing risk exposures and implementation costs (including taxes, if applicable).
The process is purely systematic. Here's how it works:
I. Data
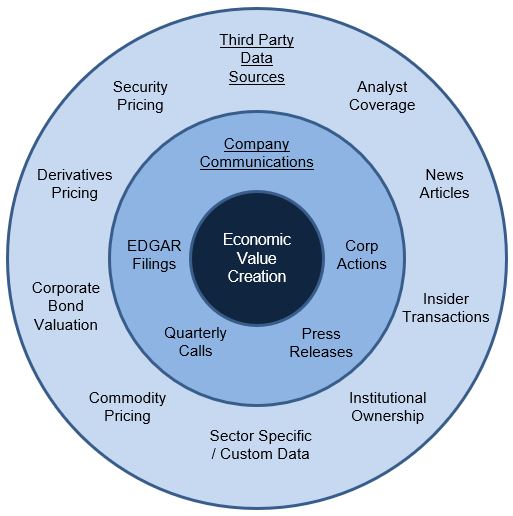
We start by accumulating as much information as possible. Behind each stock is an operating business. We source, scrub, and normalize data to build company and stock profiles through time. We get this data from the company itself, from third party sources, and from our own work.
This stage isn't glamorous, but it's essential. This data serves as a starting point for all our research.
II. Factors
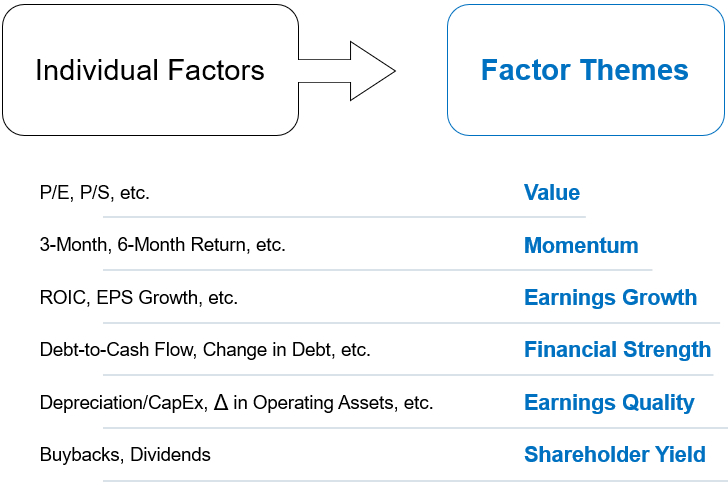
We convert raw data into factors. Factors are objective measures which we can use to compare stocks. For each factor theme—e.g. value—we combine several complimentary individual factors—e.g. price-to-cash flow, price-to-earnings, or price-to-sales—into an overall score. We use these factor scores to assess the relative prospects for stocks across the investible universe.
We use financial strength, earnings quality, and earnings growth factors to avoid bad companies whose stocks may be in jeopardy. We use value, momentum, and shareholder yield factors to select stocks that we believe have the highest probability of outperforming in the future.
Some factors, like those derived from the balance sheet, should only be compared among businesses in the same sector. Others, like momentum, are more universal and can be compared across all sectors. Some sectors, like banks or REITs, require more customized calculations.
Each factor is constructed with care, based on strong evidence. We evaluate each through the empirical lens of return, risk, consistency & persistence, and real-world costs. Evidence alone is not enough--we also focus on understanding what a given factor is measuring and why it should continue to work.
Philosophically, we believe that simple, but well-constructed models are more likely to do well in an uncertain future than complicated models that are perfectly prepared for the past.
We spend so much time on the factors themselves because different calculations can lead to very different results. Something as simple as how you define “cheap“ can lead to large differences in annualized returns—all else equal.
III. Stock Selection & Dynamic Portfolio Construction
We use our six core factors to build portfolios. This includes stock selection (what to own) and portfolio construction (in what quantities).
Selection
We begin with a specific universe of stocks—ranging from U.S. large cap, to international small cap. We build each universe ourselves, because we believe that most index methodologies are flawed (especially style-based indexes which separate stocks into growth and value). We base each universe on simple requirements including market cap and liquidity. We will often hold stocks which are not in the benchmark itself, but which are in the same geography and market capitalization ranges.
Within a given universe, we remove from consideration companies whose factor profiles suggest poor future returns, using all the factors mentioned above.
We then focus on companies with the highest ranking value, momentum, and/or shareholder yield factors. The factors used at this stage depend on the strategy's style. You can read more about our various investment strategies here.
Weighting
Within the portfolio, a stock's weight is a function of these variables:
1) How consistently it meets our criteria over time (more consistency leads to a higher weight)
2) How recently it has met our model criteria (higher weight on more recent information)
3) Its overall factor profile (better overall factor profiles lead to a higher weight)
4) Risk management considerations, which are detailed below
The purpose of portfolio rebalances is to constantly re-orient the portfolio towards those stocks with the highest ranking current profiles. Factors provide our edge through time, and rebalancing maintains that edge. We update our model portfolio for each strategy regularly, as we get new information.
Watching this process in action can be very helpful. In the animation below, the grey dots represent every investable stock in the universe for our large cap value strategy. Stocks are plotted along two key dimensions: shareholder yield on the y-axis and a combination of all other factors (momentum, value, quality factors) on the x-axis. Those which score well on both dimensions appear in the bottom left, and those with the lowest ranking scores appear in the upper right.
The blue dots are the stocks in our portfolio, and their size represents their current weight—the bigger the circle, the larger the weight.
You'll see that as months pass, we add weight to stocks—through new or additional purchases—that have the highest ranking profiles (see the green dot as an example). At the same time, we reduce weight to stocks whose factor profiles are no longer as attractive (red dot). We typically hold individual names for at least one year, and, depending on the strategy, may hold a stock for many years.
RE-PLAY DYNAMIC REBALANCE CHART
RE-PLAY CHART
In asset management, there is a tension between asset gathering and alpha generation. The more money you manage, the harder it is to earn alpha. We always opt for alpha over assets, which for factor investing means more focused exposure like what you see above. This comes at the cost of more limited strategy capacity than is typical of factor-based strategies, but we view this as a great trade. Accordingly, we strive for sufficient but not excessive diversification, because too much diversification dilutes factor exposures and therefore risk-adjusted returns. This leads us to risk management.
IV. Risk Management
We are always fully investing, taking equity market risk, so as we build portfolios we think more about active risk or tracking error: the differences between our portfolios and the broad equity market portfolio. To achieve our factor edge, we need to be different. But we want to be sure that each type of difference—or source of risk—is well compensated for.
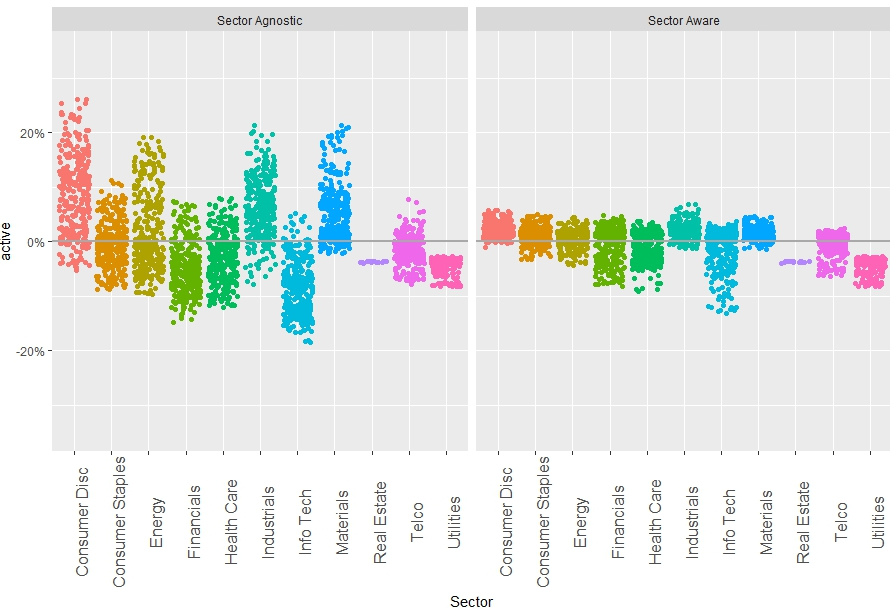
We define our own sources of risk—which tend to be simple measures like sector, industry, and region—and control for them whenever possible. We believe that a risk factor like “sector“ is useful if it consistently explains tracking error in the portfolio, through a variety of market cycles.
If we can achieve similar factor exposures with less risk, we will do so. Different is good, but not more than necessary. Here is an example of the impact that risk controls have on the portfolio, shown through the lens of active sector exposures. On the left in the chart below are the historical (simulated) active sector exposures for an unconstrained factor portfolio. On the right are the same active exposures with sector risk considered. There are still active bets, but the average magnitude, and therefore sector risk, is smaller.
Our understanding of the types of potential risks in the portfolio is informed by historical investigation and testing. These types of risks include:
Liquidity
Sector
Industry
Market Cap
Geographic Region
Factors themselves
In each case, as we've visualized in the example above, we've built the process to be different where appropriate, but also to control the risks that the evidence suggests aren't met with commensurate return.
V. Cost Management
We consider all types of costs associated with running a given strategy and the relationship of those costs to our expected excess return.
Using a diverse array of in-house technologies, we:
Manage market impact and trading costs as low as possible
Manage taxes for taxable accounts at the individual lot level, prioritizing specific lot trades to maximize after tax return.
Assess portfolio turnover through the lens of expected excess return, trading when the odds are in our favor
We also think systematically about management fees. We believe with index fees heading towards zero, the focus should be on the fees paid for the portion of a portfolio that is “active,“ or non-overlapping with the benchmark. Our “active“ fees are very low relative to peers.
VI. Sustainable Factor Advantages
Through this process, we've tried to build and maintain the most efficient factor exposures possible for our clients. We'd welcome a deeper conversation on our process, our research platform, or our investment philosophy.
Please Note: OSAM does not provide financial planning or any related consulting services. OSAM does not serve as a law firm, certified public accounting firm, nor an insurance agency. OSAM does not prepare legal documents or tax returns, nor does it sell insurance products.
The statements on this page are qualified in their entirety by the disclaimers and limitations contained here.
OSFunds.com
You are leaving the O'Shaughnessy Asset Management website and entering the O'Shaughnessy Mutual Funds website.
CONTINUE
CANVAS
You are leaving the O'Shaughnessy Asset Management website and entering the O'Shaughnessy CANVAS website.