A Historic Opportunity in Small Cap Stocks
By Jamie Catherwood
April 2020
No investment principle is more widely understood and frequently ignored than ‘buy low, sell high’. While we would not hesitate to buy at discounted prices in other aspects of life, investing in assets with poor recent returns just feels wrong. However, it is because buying stocks at discounted prices feels wrong, that it can often turn out to be right.
Amid an almost unprecedented market environment in which coronavirus has shut down global economies, there are relatively few investors showing enthusiasm for equities in the near-term. Despite lower valuations implying better future investment outcomes, our human instinct tells us not to buy. This is why OSAM favors a systematic approach that prevents our instincts and emotions from inhibiting good decision-making. While the media provides endless reasons to feel pessimistic, the evidence shows attractive opportunities in the market for long-term investors. As the saying goes, be greedy when others are fearful.
It is crucial to remember in a downturn that ‘once in a lifetime’ crises also present historic opportunities.
A HISTORIC OPPORTUNITY IN SMALL CAP STOCKS
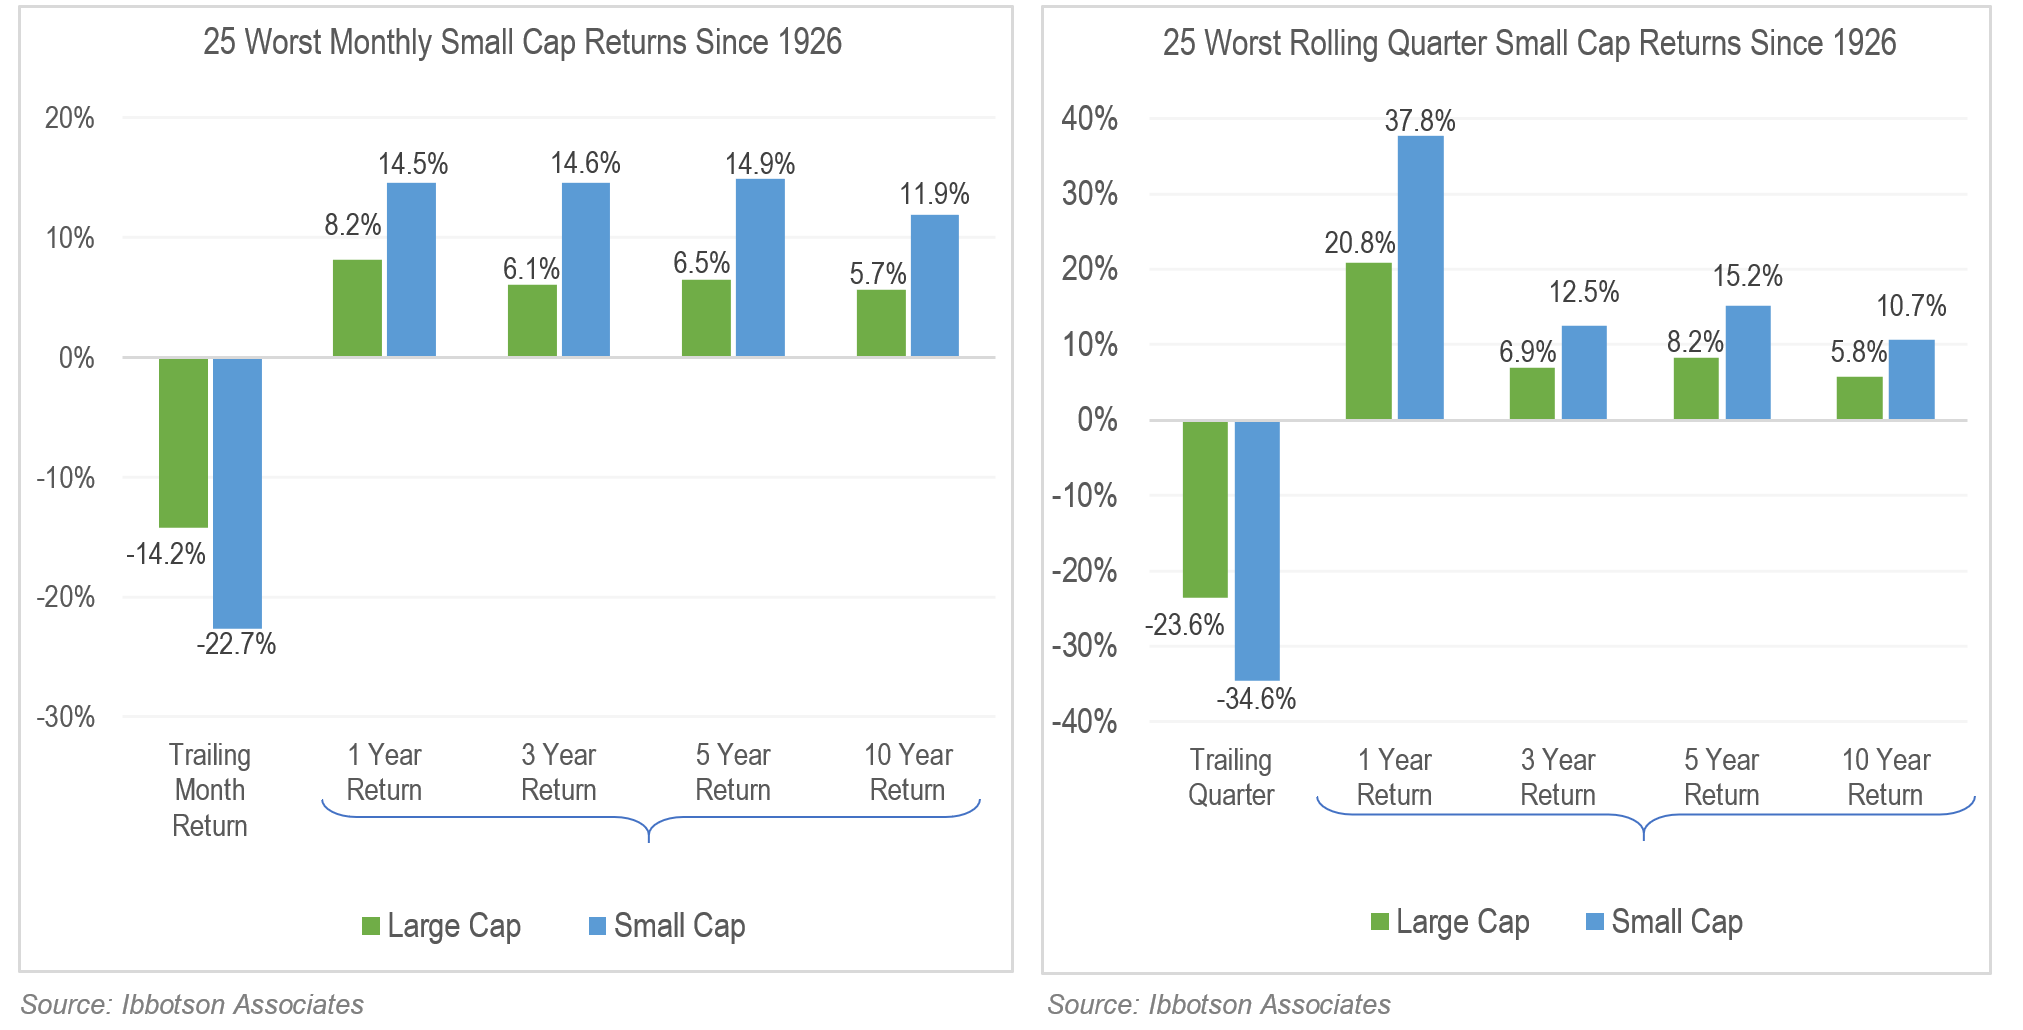
Every so often there are opportunities that may only appear 2-3 times in an investor’s career, usually around a bear market or recession. In light of the recent bear market, evidence suggests that a historic opportunity may be forming in small cap stocks, among the lowest returning assets in March (Russell 2000 Index, -21.73%) and Q1 (Russell 2000 Index, -30.61%).
Yet, small cap stocks are one of the better returning assets after bear markets. As the data below shows, small stocks are generally the lowest performers as markets fall, but then significantly outperform when markets recover. These charts exhibit the average forward returns in the 25 lowest ranking months and rolling quarters for small cap companies. The relative advantage of small cap stocks following market declines is clear:
THE CASE FOR SMALL CAP VALUE
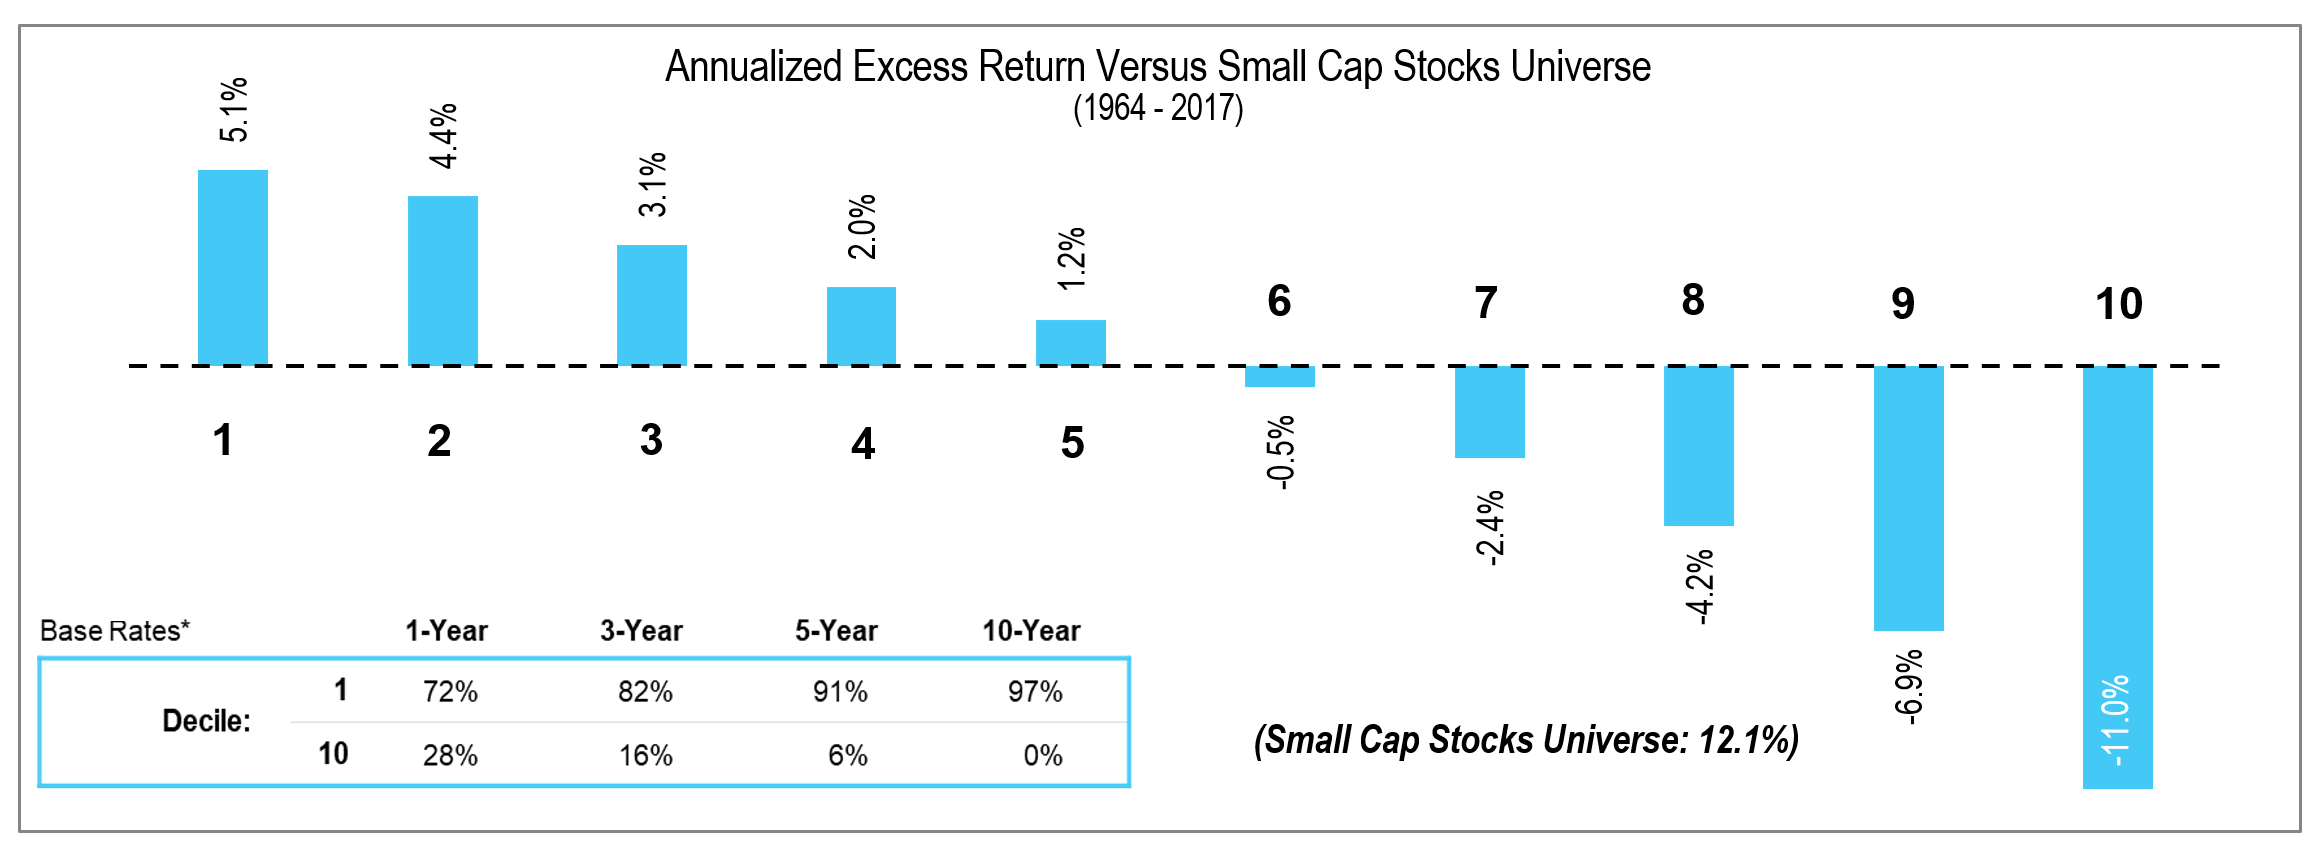
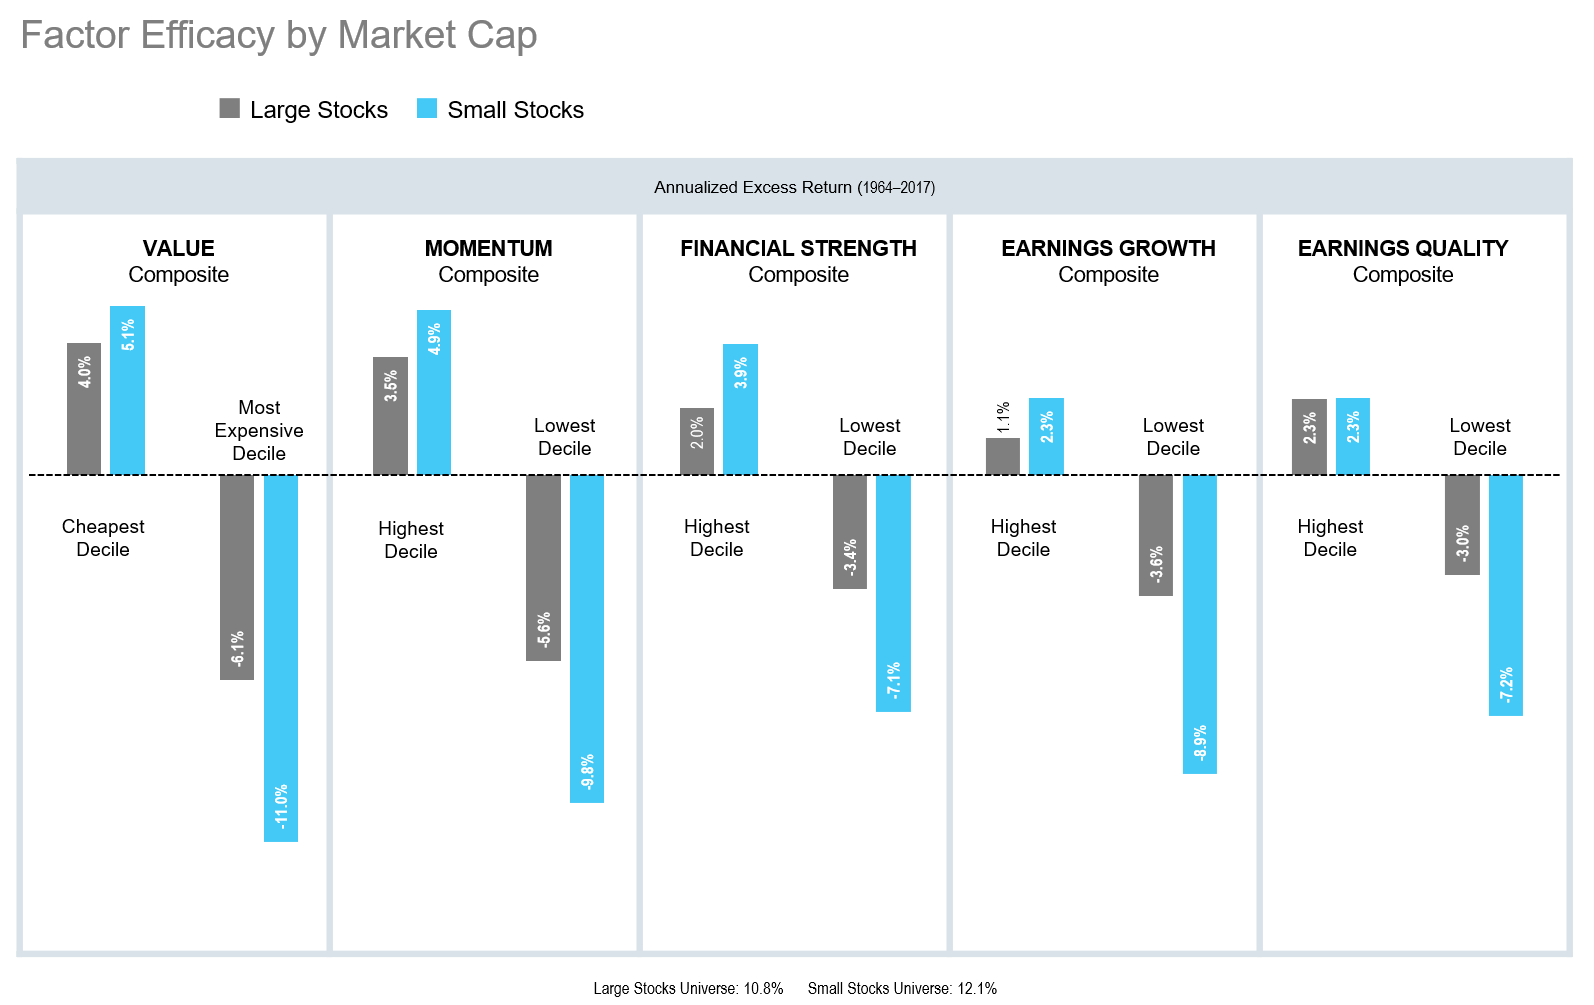
There is ample data demonstrating the outperformance of smaller cheaper stocks over the long term. The chart below shows the annualized excess return of small cap stocks within each decile of stocks measured by their cheapness. On the far left, the cheapest stocks generated an annualized excess return of 5.1% over the 54-year study, while the most expensive stocks on the far right underperformed by -11.0% annualized.
That said, while there may be a historic opportunity in small cap companies as a whole, small cap value stocks are particularly attractive.
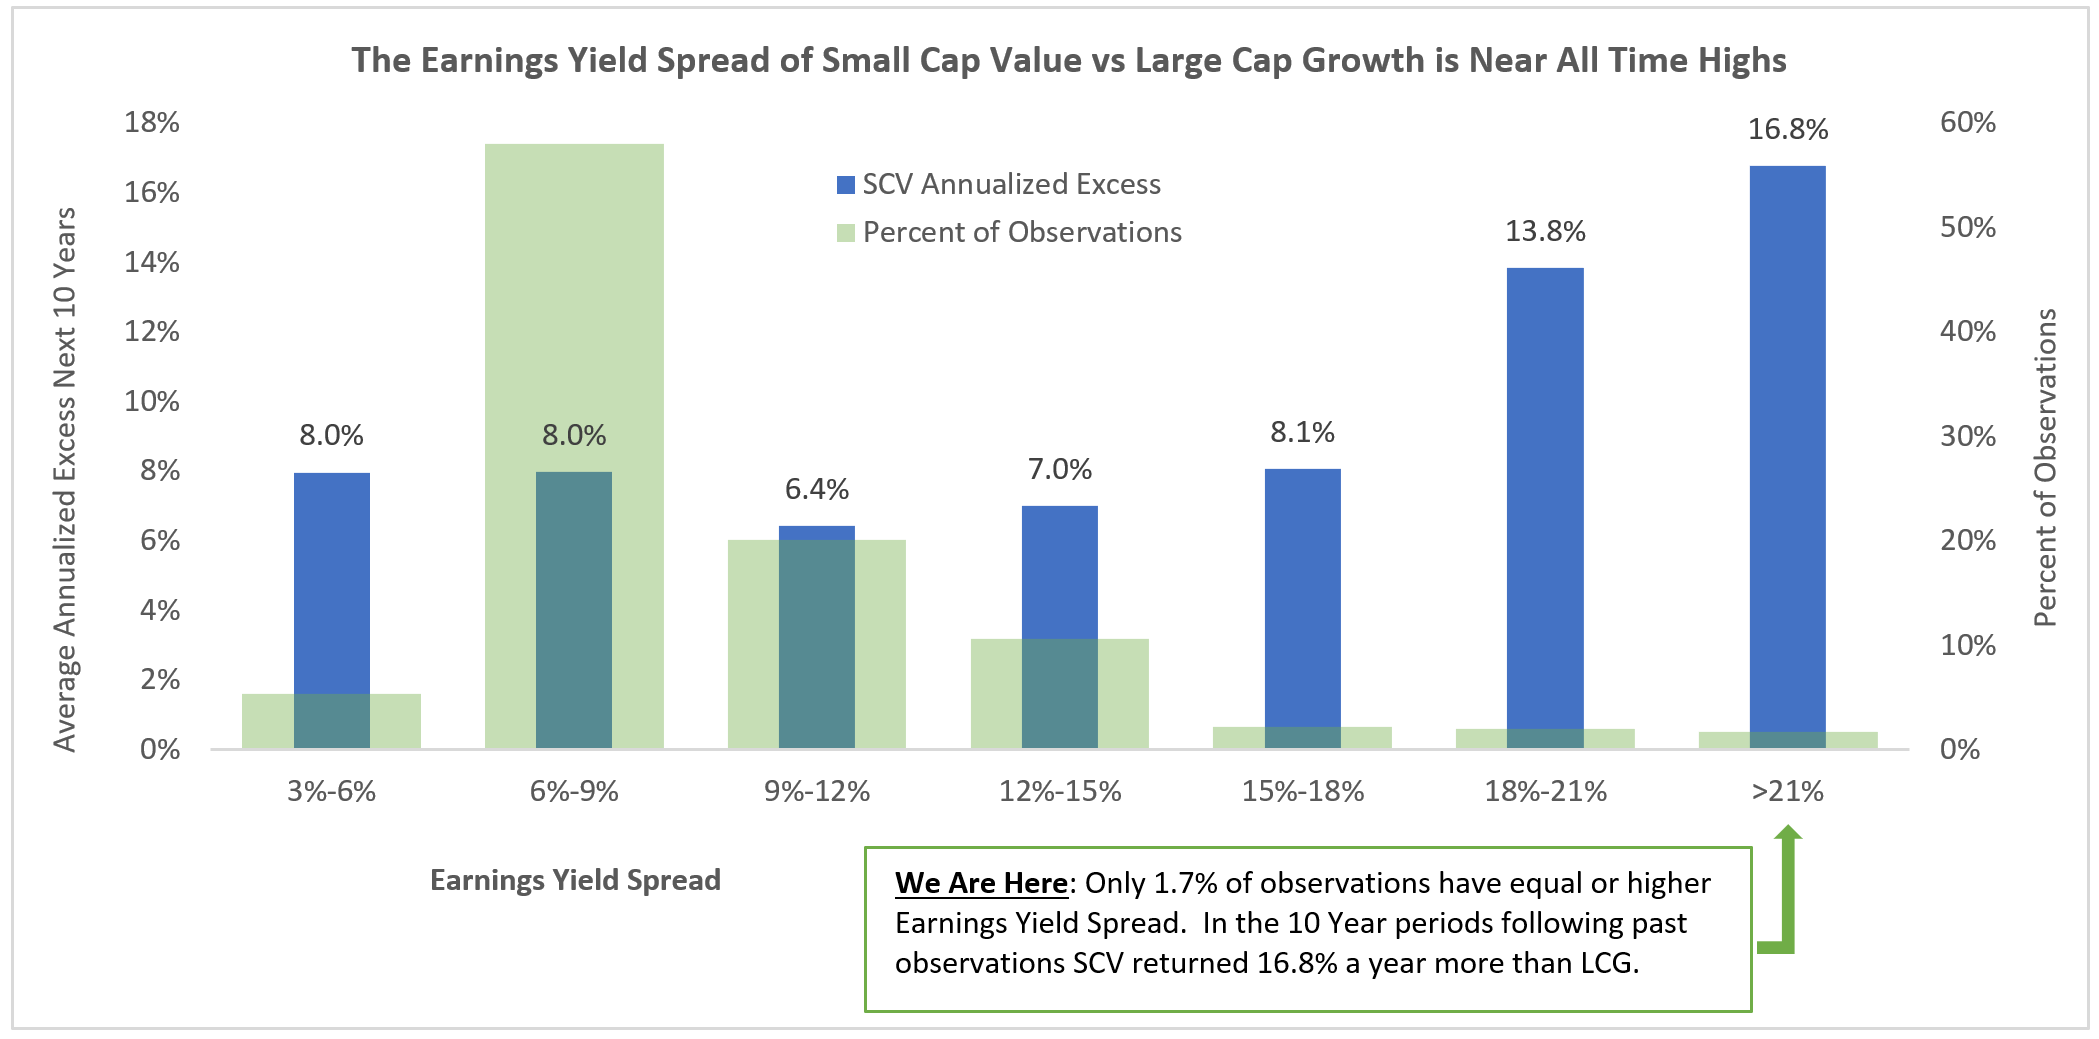
Small Cap Value & Large Cap Growth Spreads Near All Time Highs
Using history as a guide, the current environment in small cap stocks is almost unprecedented. When comparing the earnings yield of the cheapest small stocks (cheapest decile by price-to-earnings) to the most expensive decile of large cap stocks in the US we see a spread of more than 21%. Following extreme periods like this historically, small value outperformed large growth by 16.8% annualized over the following 10 years.
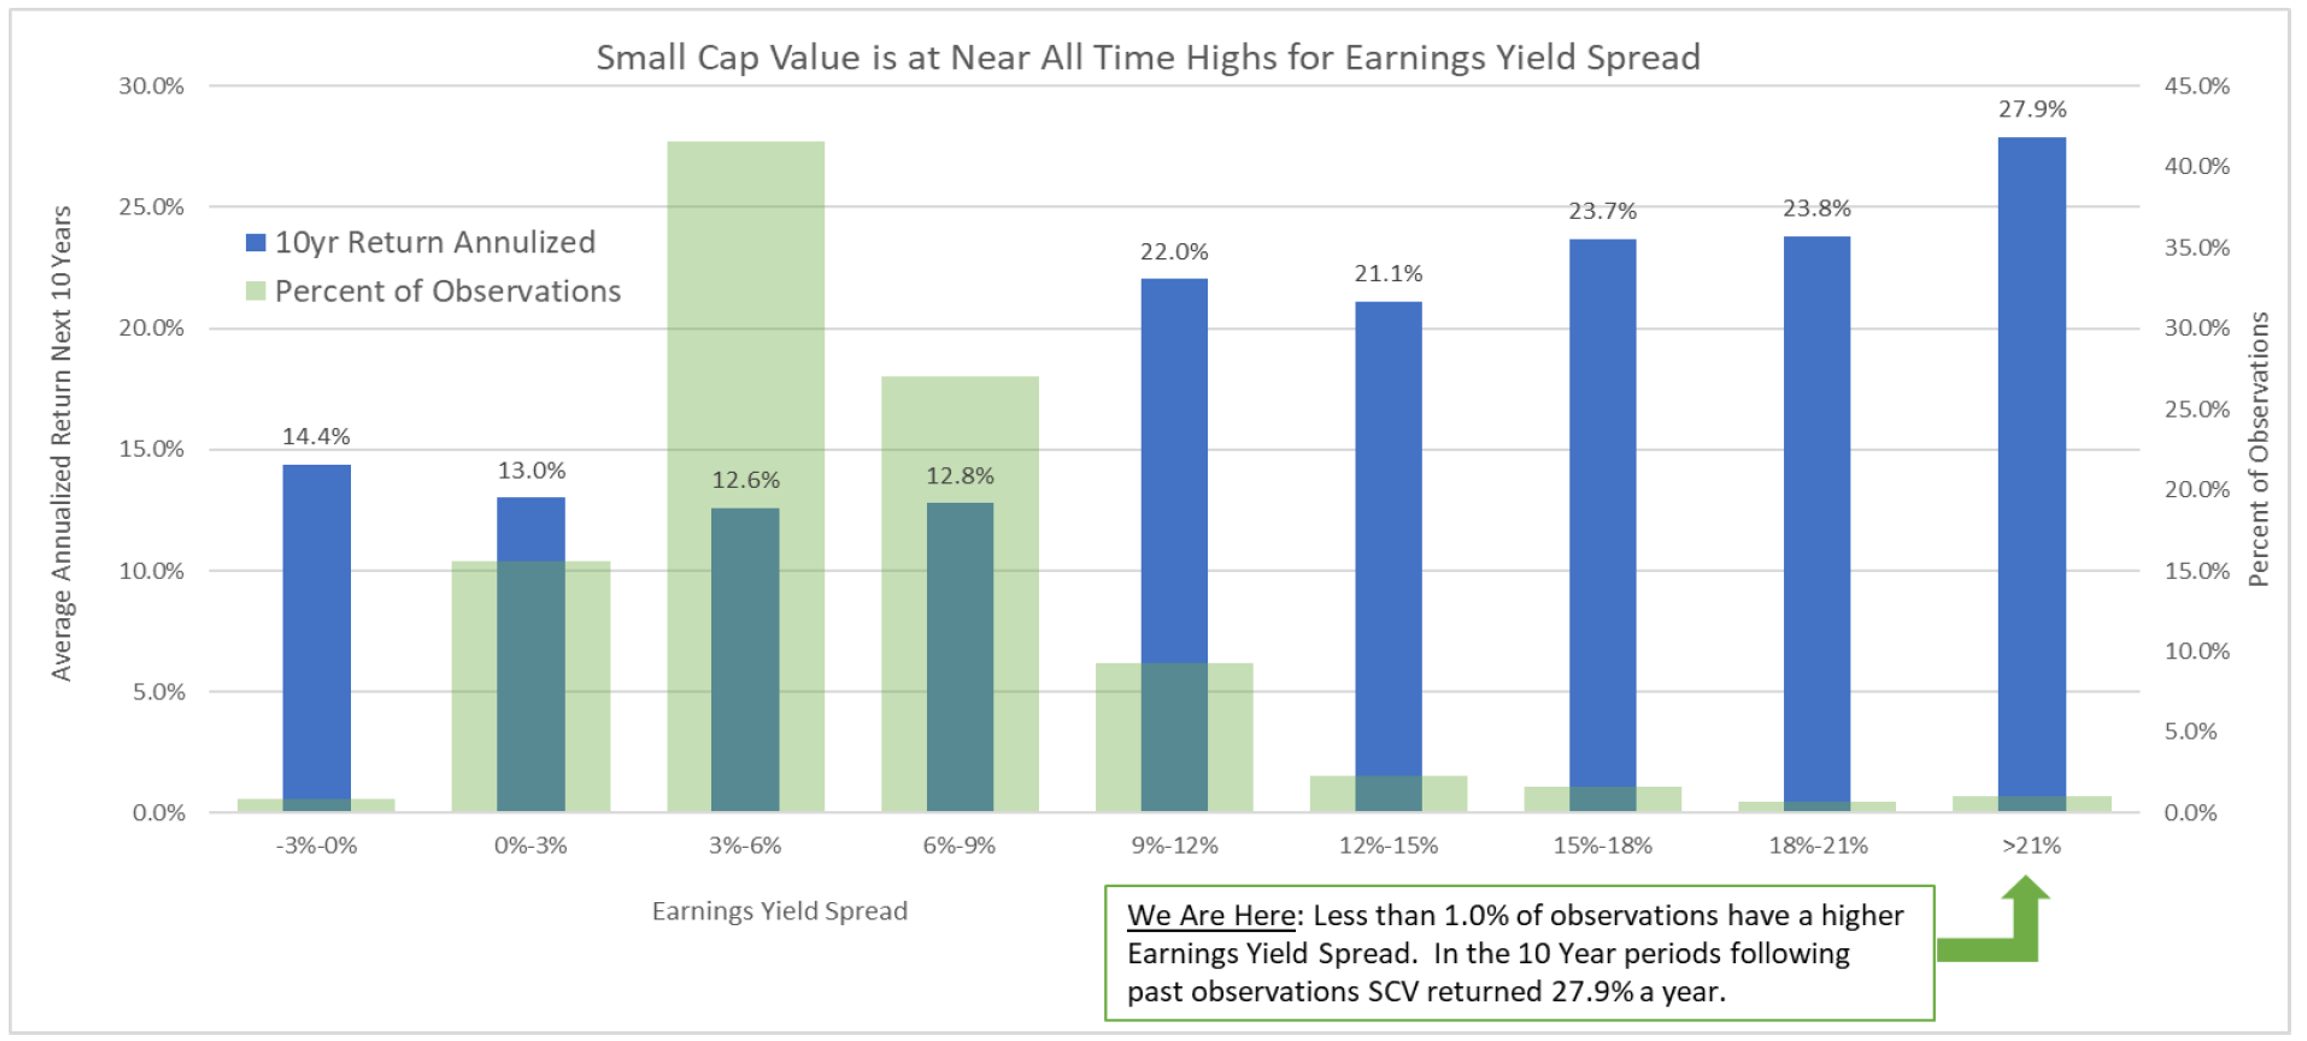
Earnings Yield Spread on Small Cap Value & 10-Year Treasury Near All Time Highs
A similar dynamic exists in the earnings yield on small cap stocks (cheapest decile) and the 10-year U.S. Treasury yield. This spread is generally between 3-6%, but is greater than 20% today. Following similar spreads in the past, small value stocks returned an average of 27.9% in the subsequent 10-year period.
INCORPORATING QUALITY IN SMALL CAP VALUE
While small cap value has a long record of generating meaningful outperformance, we must emphasize that investors should not simply buy the cheapest decile of small stocks. Due to their size, small cap companies are generally more susceptible to economic shocks like the one we currently face. By merely buying the cheapest group of small cap stocks, there is no safeguard protecting investors from unstable companies ill-prepared for an economic downturn.
For this reason, it is crucial to incorporate quality factors in the investment process for avoiding these unprepared and ill-equipped companies. At OSAM, we screen out companies from our investable universe that score poorly on Financial Strength (highly levered companies reliant on external funding), Earnings Quality (companies with non-cash earnings and aggressive accounting), and Earnings Growth (declining free cash flow and profitability). These quality factors have an even greater impact in the small cap universe:
Reducing Risk in Market Downturns Through Quality Factors
There is a popular model in financial history called the Kindleberger-Minsky model, which states that the ‘fraud cycle’ lags the market cycle. Said differently, frauds and bad businesses usually don’t get exposed until markets fall, and investors became more skeptical and conservative. The infamous Worldcom fiasco after the Dot Com crash, and Bernie Madoff’s ponzi scheme blowing up amid the Great Financial Crisis are prime examples.
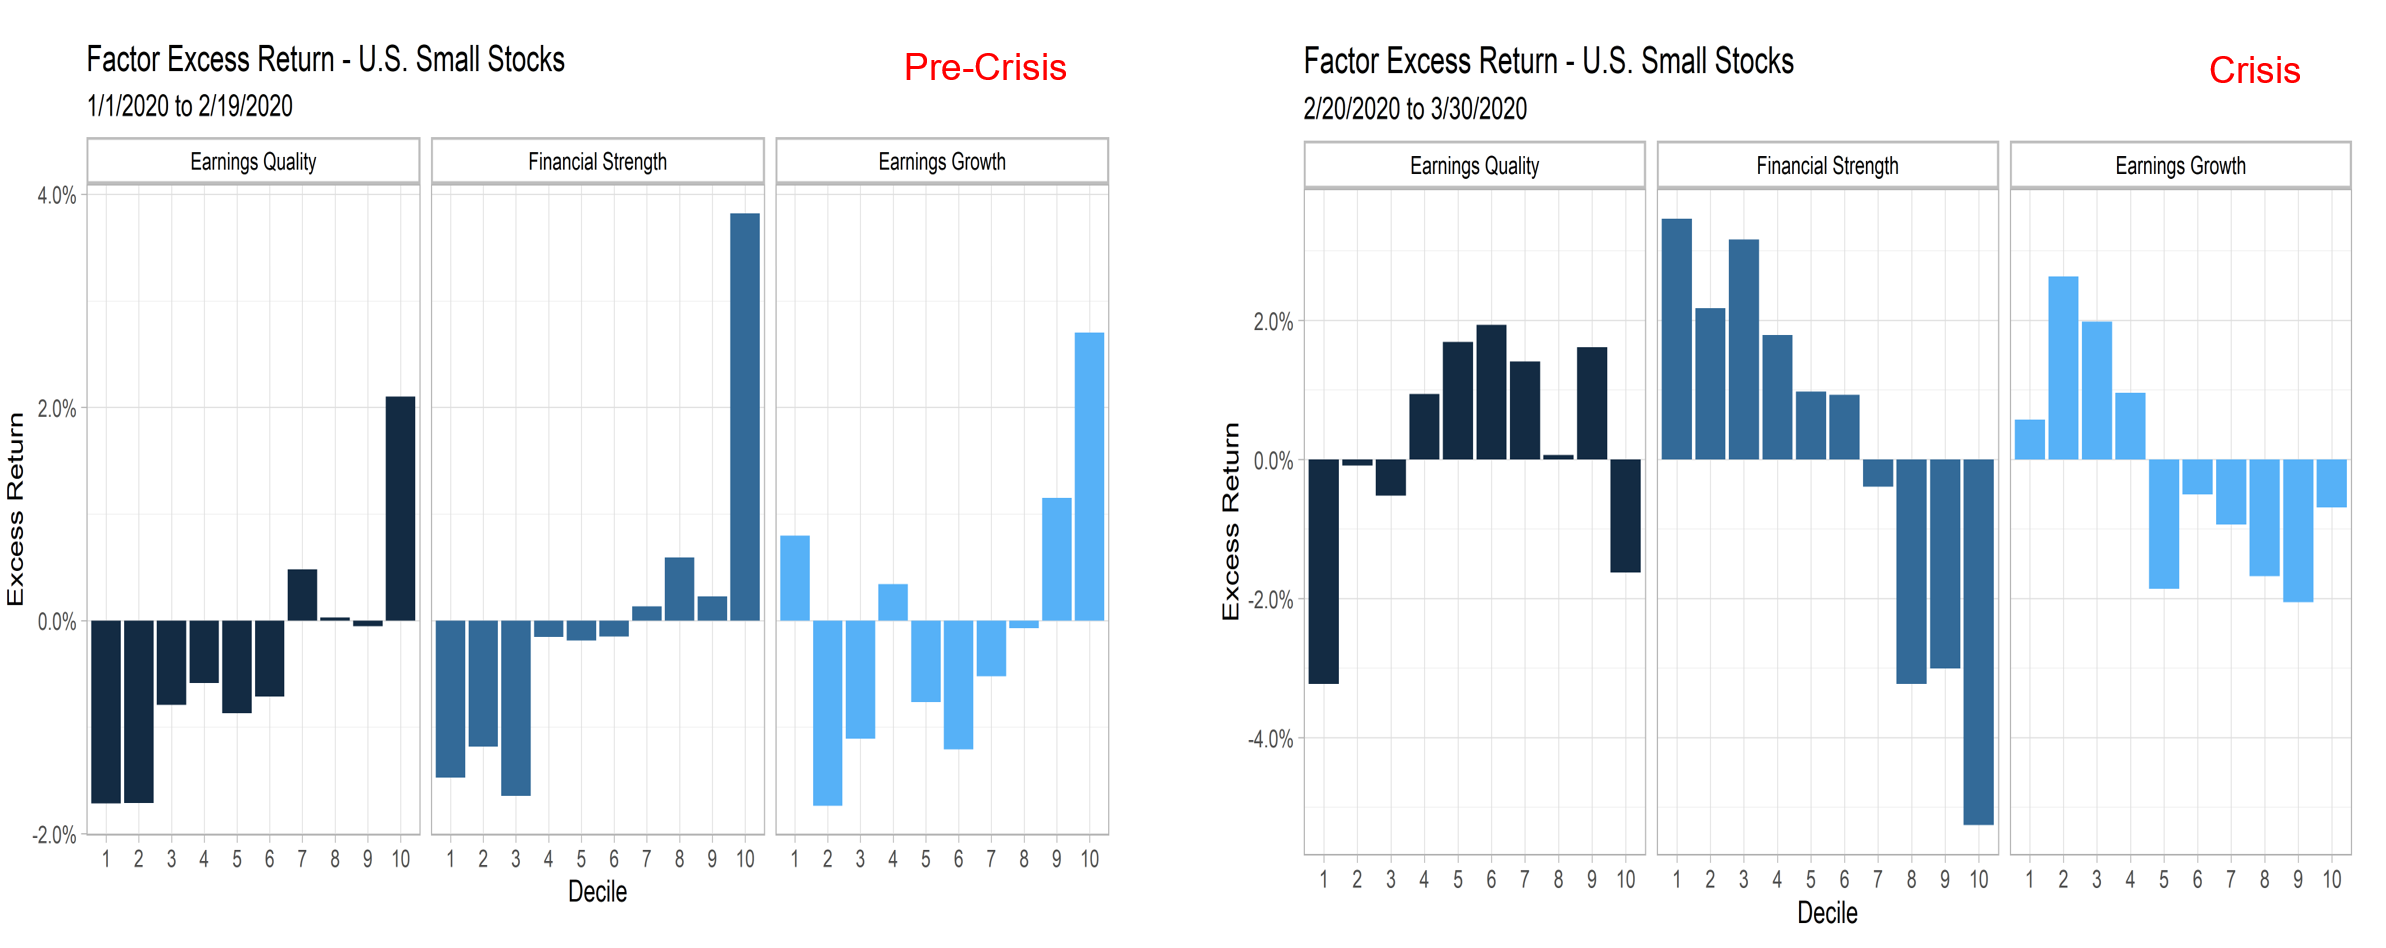
This is relevant for investors because it means market downturns simultaneously create historic opportunities to buy stocks at lower prices, but also pose increased risks as companies with questionable accounting and business models are exposed. The first quarter of 2020 offered a glimpse of this phenomenon. Before the downturn began on February 19th, when markets were up and sentiment was high, companies in the lowest decile of our quality measures outperformed the market. When markets dropped, however, these low quality companies significantly underperformed as investors sought refuge in companies with good financial strength and earnings growth.
OSAM SMALL CAP VALUE STRATEGY
There is clearly risk in indiscriminately buying small cap stocks during market downturns. In OSAM’s Small Cap Value strategy our Earnings Quality, Financial Strength and Earnings Growth overlays ensure that while investing in one of the better returning assets exiting downturns, the strategy is only buying companies with good financials and strong fundamentals, while avoiding the lowest scoring.
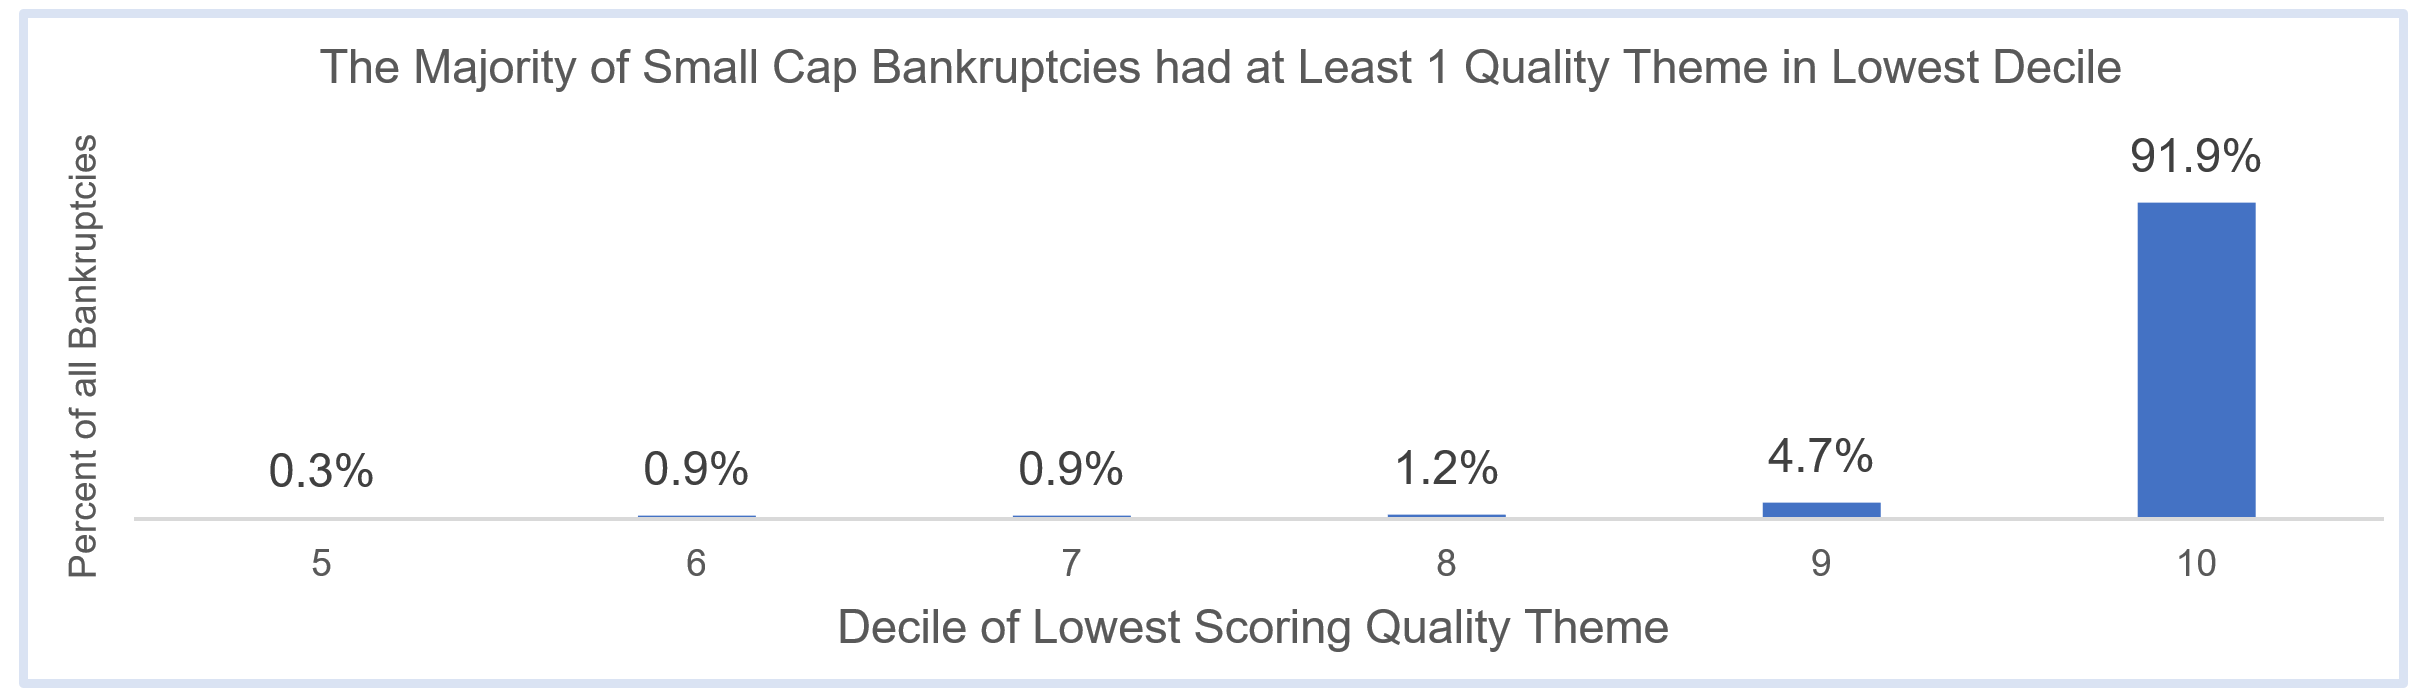
To demonstrate the efficacy of this approach, our systematic use of Quality as an exclusionary factor has been critical in avoiding worst-case scenarios like bankruptcy. The chart below shows that 92% of bankruptcies in the small cap space were identified ex-ante by falling into one of the lowest deciles of our quality themes—stocks that we specifically exclude in our process.
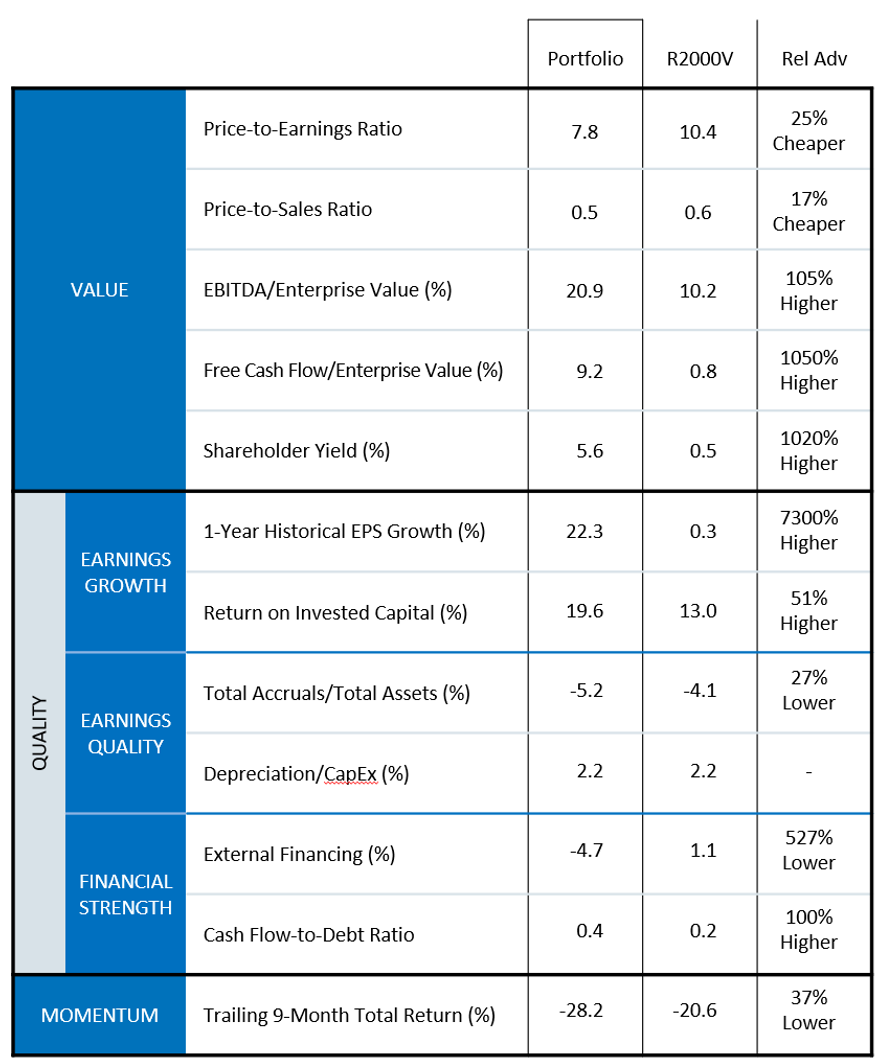
What is the result? A portfolio with substantial advantages over the benchmark in terms of valuation, returning cash to shareholders, and quality. As of March 31st, the Small Cap Value portfolio was 25% cheaper than the Russell 2000 Value index (measured by Price/Earnings), had a 1,020% higher Shareholder Yield ratio, and 1-year historical EPS growth rate over 7,000% higher than the benchmark. In terms of quality, the portfolio was significantly less reliant on external financing (527% lower), had a 100% higher Cash Flow-to-Debt ratio, and higher use of accruals (27% lower).
In these times of market stress, we believe the Small Cap Value strategy is poised for strong performance moving forward by investing in one of the better returning categories out of bear markets, holding companies with significantly better characteristics than the benchmark, and investing at near record-high earnings yield spreads with other assets, implying higher future returns.
Since March 2004 through March 31st, 2020 the Small Cap Value SMA outperformed the Russell 2000 Value benchmark in 92% of rolling 5-year periods (3.3% Avg. Excess Return), and 95% of rolling 10-year periods (3.3% Avg. Excess Return).
If you’re interested in learning more about our research, our Small Cap Value strategy is available in both SMA and mutual fund investment vehicles, please reach out to our team. We’d love to speak with you further.
GENERAL LEGAL DISCLOSURES & HYPOTHETICAL AND/OR BACKTESTED RESULTS DISCLAIMER
The material contained herein is intended as a general market commentary. Opinions expressed herein are solely those of O’Shaughnessy Asset Management, LLC and may differ from those of your broker or investment firm.
Please remember that past performance may not be indicative of future results. Different types of investments involve varying degrees of risk, and there can be no assurance that the future performance of any specific investment, investment strategy, or product (including the investments and/or investment strategies recommended or undertaken by O’Shaughnessy Asset Management, LLC), or any non-investment related content, made reference to directly or indirectly in this piece will be profitable, equal any corresponding indicated historical performance level(s), be suitable for your portfolio or individual situation, or prove successful. Due to various factors, including changing market conditions and/or applicable laws, the content may no longer be reflective of current opinions or positions. Moreover, you should not assume that any discussion or information contained in this piece serves as the receipt of, or as a substitute for, personalized investment advice from O’Shaughnessy Asset Management, LLC. Any individual account performance information reflects the reinvestment of dividends (to the extent applicable), and is net of applicable transaction fees, O’Shaughnessy Asset Management, LLC’s investment management fee (if debited directly from the account), and any other related account expenses. Account information has been compiled solely by O’Shaughnessy Asset Management, LLC, has not been independently verified, and does not reflect the impact of taxes on non-qualified accounts. In preparing this report, O’Shaughnessy Asset Management, LLC has relied upon information provided by the account custodian. Please defer to formal tax documents received from the account custodian for cost basis and tax reporting purposes. Please remember to contact O’Shaughnessy Asset Management, LLC, in writing, if there are any changes in your personal/financial situation or investment objectives for the purpose of reviewing/evaluating/revising our previous recommendations and/or services, or if you want to impose, add, or modify any reasonable restrictions to our investment advisory services. Please Note: Unless you advise, in writing, to the contrary, we will assume that there are no restrictions on our services, other than to manage the account in accordance with your designated investment objective. Please Also Note: Please compare this statement with account statements received from the account custodian. The account custodian does not verify the accuracy of the advisory fee calculation. Please advise us if you have not been receiving monthly statements from the account custodian. Historical performance results for investment indices and/or categories have been provided for general comparison purposes only, and generally do not reflect the deduction of transaction and/or custodial charges, the deduction of an investment management fee, nor the impact of taxes, the incurrence of which would have the effect of decreasing historical performance results. It should not be assumed that your account holdings correspond directly to any comparative indices. To the extent that a reader has any questions regarding the applicability of any specific issue discussed above to his/her individual situation, he/she is encouraged to consult with the professional advisor of his/her choosing. O’Shaughnessy Asset Management, LLC is neither a law firm nor a certified public accounting firm and no portion of the newsletter content should be construed as legal or accounting advice. A copy of the O’Shaughnessy Asset Management, LLC’s current written disclosure statement discussing our advisory services and fees is available upon request.
Hypothetical performance results shown on the preceding pages are backtested and do not represent the performance of any account managed by OSAM, but were achieved by means of the retroactive application of each of the previously referenced models, certain aspects of which may have been designed with the benefit of hindsight.
The hypothetical backtested performance does not represent the results of actual trading using client assets nor decision-making during the period and does not and is not intended to indicate the past performance or future performance of any account or investment strategy managed by OSAM. If actual accounts had been managed throughout the period, ongoing research might have resulted in changes to the strategy which might have altered returns. The performance of any account or investment strategy managed by OSAM will differ from the hypothetical backtested performance results for each factor shown herein for a number of reasons, including without limitation the following:
- Although OSAM may consider from time to time one or more of the factors noted herein in managing any account, it may not consider all or any of such factors. OSAM may (and will) from time to time consider factors in addition to those noted herein in managing any account.
- OSAM may rebalance an account more frequently or less frequently than annually and at times other than presented herein.
- OSAM may from time to time manage an account by using non-quantitative, subjective investment management methodologies in conjunction with the application of factors.
- The hypothetical backtested performance results assume full investment, whereas an account managed by OSAM may have a positive cash position upon rebalance. Had the hypothetical backtested performance results included a positive cash position, the results would have been different and generally would have been lower.
- The hypothetical backtested performance results for each factor do not reflect any transaction costs of buying and selling securities, investment management fees (including without limitation management fees and performance fees), custody and other costs, or taxes – all of which would be incurred by an investor in any account managed by OSAM. If such costs and fees were reflected, the hypothetical backtested performance results would be lower.
- The hypothetical performance does not reflect the reinvestment of dividends and distributions therefrom, interest, capital gains and withholding taxes.
- Accounts managed by OSAM are subject to additions and redemptions of assets under management, which may positively or negatively affect performance depending generally upon the timing of such events in relation to the market’s direction.
- Simulated returns may be dependent on the market and economic conditions that existed during the period. Future market or economic conditions can adversely affect the returns.


